Change is the new normal. Volatility abounds.
In keeping with the environment, I would like to write about a quantitative analysis exercise that we performed. Since the findings are very interesting from an investment perspective, I thought it would be a good idea to share it.
In a bid to generate wealth from the equity market, investors study and use several valuation techniques, both fundamental and technical. Valuations are looked at through the prism of cash flows, earnings, corporate governance, return ratios, debt equity proportion and so on. Within these, the most primary valuation tool used by investors is the Price Earnings (P/E) ratio.
Hence, we carried out an extensive statistical analysis of the movement in the Sensex P/E ratio over the last 17 years and attempted to estimate its relationship with the likely returns based on regression analysis.
The basics….
The P/E ratio is computed by dividing the market price with the company’s Earning Per Share (EPS). The market P/E or Index P/E is computed the same way as that of individual stocks. The P/E ratio of the stock market index is the weighted average of the P/E of the companies included in the index. Stocks with low PE ratio are perceived as having cheaper current price, hence expected to generate higher return in subsequent period.
Generally, there are two variations of the P/E ratio: Trailing P/E and Forward P/E.
The Trailing P/E ratio uses the earnings of the last 12 months, while the Forward P/E uses the expected earnings for the next 12 months. The Forward P/E requires estimating the forward earnings and hence, is prone to estimation errors. Moreover, the same is not easily available to everyone, while the trailing P/E ratio is easily available on a real time basis.
Looking at its widespread use and simplicity, we thought it will be useful to study this ratio and analyze whether it can serve as a useful indicator for investors. The study of the historical trend in the P/E ratio of the index provides useful information to investors on the attractiveness of the market.
Sensex Trailing P/E Ratio: The overvalued and undervalued zones.
We carried out a statistical analysis of movement in Sensex P/E ratio over the last 17 years and tried to estimate its relationship with the likely returns based on regression analysis. We ran a regression of Sensex returns based on historical P/E Ratio.
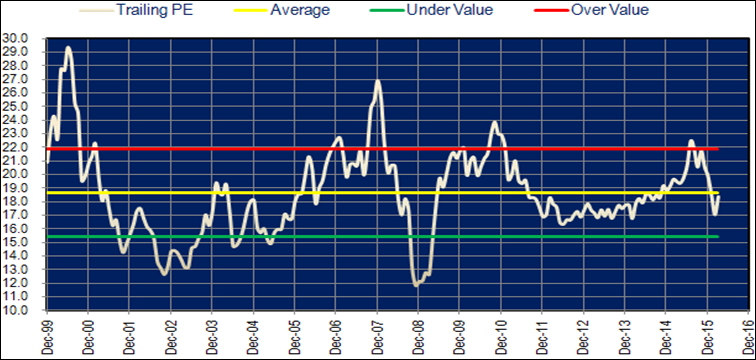
We found that the average trailing P/E ratio of the Sensex has been in the region of 18.5-19. While it touched a high of 29 during the dotcom bubble in 2000, it also hit a low of 12 in 2008 during the U.S. sub-prime crisis.
Based on the level of P/E and subsequent index returns, we noticed that there is indeed a simple inference that can be drawn from the chart shown above. This historical chart clearly demonstrates that the index enters the overvalued zone at P/E of above 21 and is in the undervalued zone below 16.
The current P/E at 19.5 (based on March-end 2016 data) is marginally higher than historical average, though it did come down below 17 during the month of February 2016, before moving up.
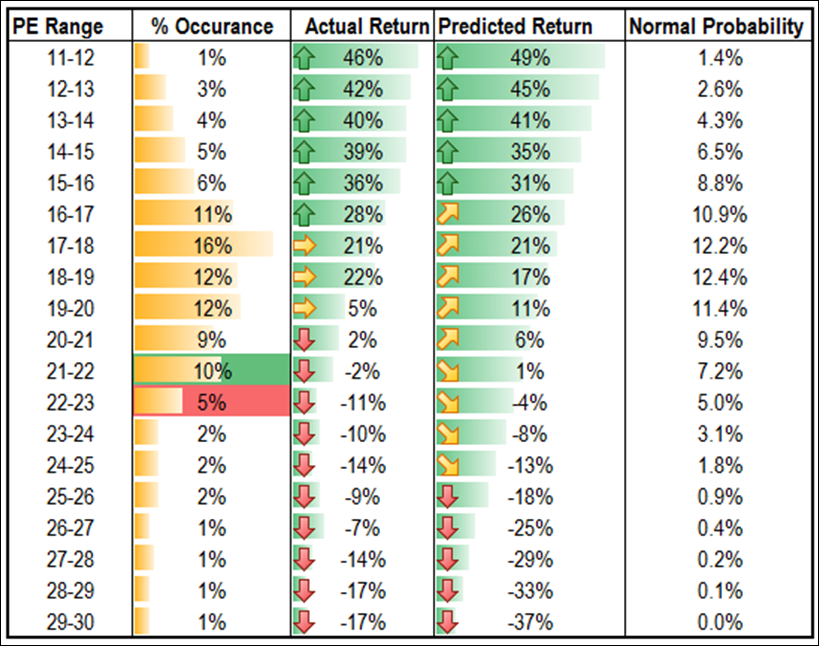
Higher losses at P/E above 25…
We also compared the Sensex Returns predicted by the regression analysis over 1, 2, 3 and 5 Years. The data study threw up one interesting conclusion: Odds of higher losses go up significantly at P/E levels beyond 25. The best fit for projecting through this model is up to 2 years.
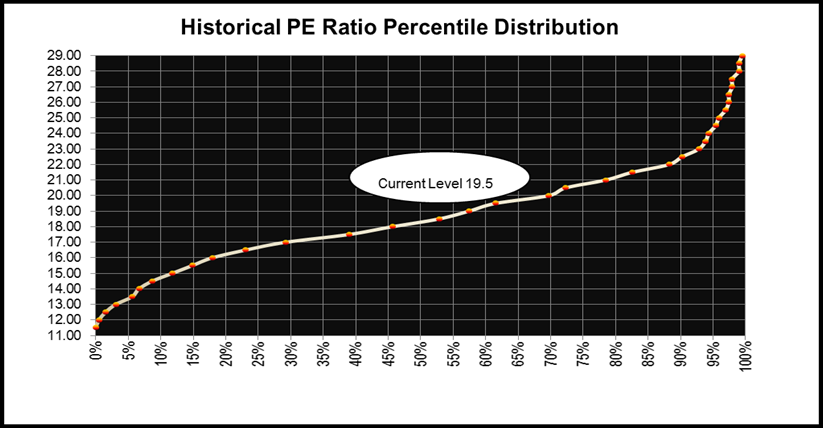
…But the PE has been <=17 only 30% of the time
The following chart shows the percentile distribution of Sensex P/E. In layman terms, the chart below indicates the historical P/E movement in different periods and also indicates the percentage time spent by the index in a particular valuation zone. It is pertinent to note that the trailing P/E has been in the region of 17 or below only 30% of the time.
What does this mean for investors?
The trailing P/E ratio and the Sensex returns have a strong correlation and study of the same provides some useful insights in to the stock market returns. Going by the historical data, and our statistical analysis, the Sensex delivers higher return whenever the trailing P/E ratio moves below 17, and the probability of delivering negative return increases whenever the same crosses 21.
While SIP strategy should be the preferred mode for equity investors, as it takes care of all the aforementioned volatility, informed investors can also use the periods where the market is in the undervalued zone (based on the P/E) to tactically enhance their exposure to equities.