Newton’s second law of motion, that force is mass times acceleration, is easy to intuitively understand. Imagine a large wrecking ball accelerating towards a concrete wall, the outcome is force.
No, this is not a physics lecture but a framework in which to think about growth investing.
At $2.3 trillion of nominal GDP, India is the seventh-largest economy in the world, and with an average nominal GDP growth of 11.7% over last five years, it’s easily the fastest growing. This is the Newtonian-winning combination of size (mass) and growth (acceleration). Over the past 14 years, there hasn’t been a single year when India did not grow double digit in nominal terms.
Nominal GDP of top 10 countries (2016 Nominal GDP USD tn)

This ability to skirt big boom and busts, despite high levels of growth, should make it a top destination for any growth investor.
Before this seems like a “happily ever after” story, an investor must appreciate that the composition of India’s GDP and the country’s indexes is vastly different. While India has had consistent double-digit GDP growth, Nifty earnings for the past three years have grown at a rate of just 1.8%. This is because outward-facing companies constitute a large chunk of the indexes. By outward-facing companies, we mean export-oriented sectors like technology and pharmaceuticals, companies linked to global commodity cycles and those that derive significant value from their overseas subsidiaries. Credit Lyonnais Securities Asia (CLSA) estimates that such outward facing companies make up almost 49% of Nifty earnings.
Therefore, I believe investors who are convinced about the India growth story, and who quickly jump in and buy an index-linked passive fund, are doing themselves a huge disservice.
The index is not the best representation of domestic growth opportunities and one is arguably better off looking for an active manager who can sift through them for higher returns.
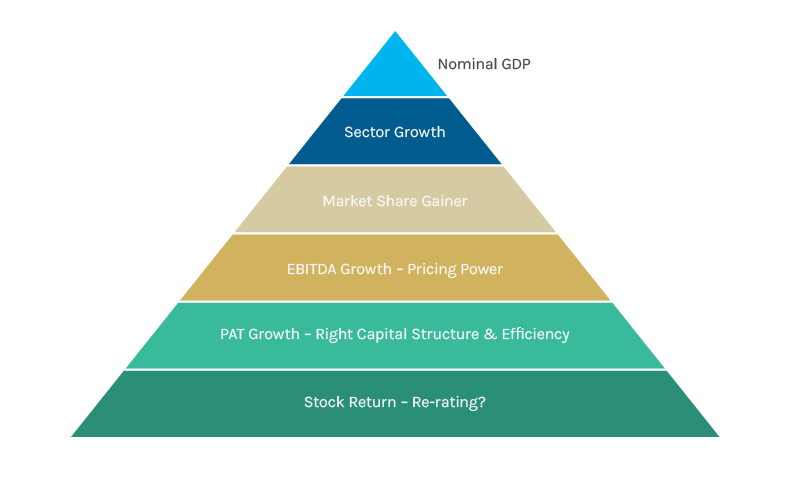
A large macro opportunity for growth can potentially transform into a profitable micro opportunity for investors only when there are a number of listed companies that operate in these growth spaces. An ideal filter would be to look for sectors that are growing faster than nominal GDP. Within those sectors, look for companies gaining market share i.e. growing their revenues faster than sector growth. If such companies are doing it profitably and with the right capital structure, it will manifest into profits growing faster than revenues.
In our experience, markets normally re-rate such attributes. This means investors are willing to pay higher multiples for the same cash flows and earnings, implying stock returns could be higher than profit growth. Think of this as a pyramid, with nominal GDP on top and stock returns at the bottom. When the top of the pyramid is easily clocking double-digit growth rates, you can reasonably expect to see higher growth numbers as you progress down the pyramid.
The macro-micro linkage framework
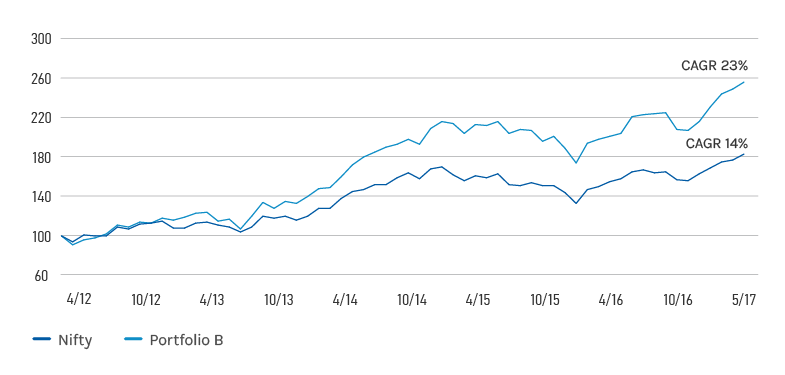
To test this, we ran a simple back-test. We looked for companies in India with compound earnings growth rates of 15% or more and, with an average return on equity in excess of 15% over the past 3 and 5 years. Two things stood out: the opportunity set for investment and the returns it produced. Three years ago, there were 166 companies in India with market capitalisation in excess of $1 billion. Of these, 31 companies satisfied our criteria and had a cumulative starting market capitalisation of almost $130 billion. An equal-weighted investment portfolio of these 31 companies would have seen you outperform the Nifty by a whopping annualised 19% over a three-year period. Similar analysis of an equal weighted portfolio of 33 companies for a five-year period yields an excess return of 9%.
Growth + Quality vs. Nifty
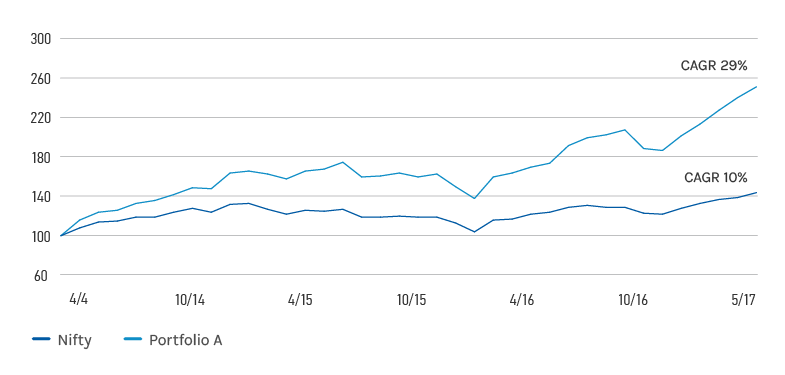
Performance – 3 Years as of May 2017 (rebased to 100)
Note: Portfolio A and B are equal-weighted portfolios of companies having starting market cap >=USD 1bn, earnings CAGR of 15% and average RoE of 15% Source: FactSet, Morgan Stanley Investment Management. Past performance is no guarantee of future results. The information shown herein is provided for illustrative purposes only and not representative of any Morgan Stanley product or strategy. All information presented is back-tested. Back-tested performance is not actual performance, but is hypothetical. Hypothetical performance results have inherent limitations. One of the limitations is that decisions were made with the benefit of hindsight. Therefore, performance results often show positive rates of return. Another limitation is that decisions reflected in the performance record were not made under actual market conditions and, therefore, cannot completely account for the impact of financial risk in actual trading.
In the process of investing, I believe one is quite likely to get a few calls wrong, but with a disciplined growth philosophy and a large opportunity set, the odds of generating good absolute, as well as relative, returns are in your favour. Also, remember that we restricted the analysis to companies with an initial market capitalisation in excess of $1 billion. There are many companies which satisfy our criteria lower down the capitalisation curve that would be fertile hunting grounds for the growth investor.
One thing we are convinced about when looking for companies and sectors that we’d like to further investigate into, is that our primary filter will never be valuations. We do not focus our energies on stocks and sectors that trade at low valuations merely because they are at those levels. Brokerage firm Ambit Capital did the numbers and significantly concluded that there is no correlation between starting point valuations and subsequent returns for time periods in excess of three years.
Starting point valuations and subsequent returns
The first visual shows correlation of 3-year returns with starting P/E multiple and the second looks at 5-year returns.
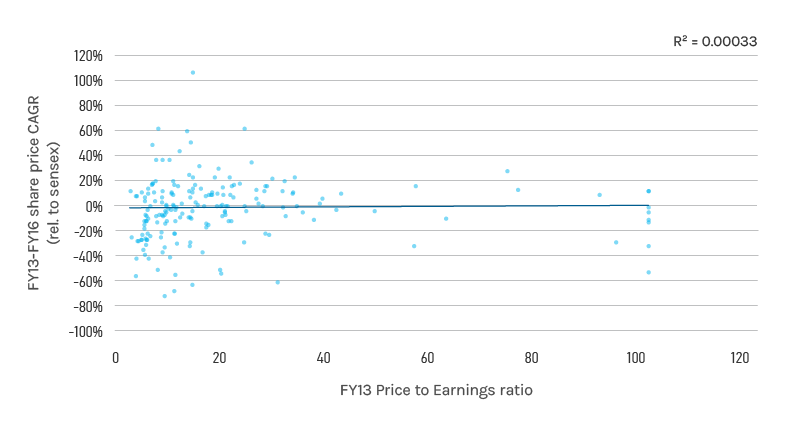
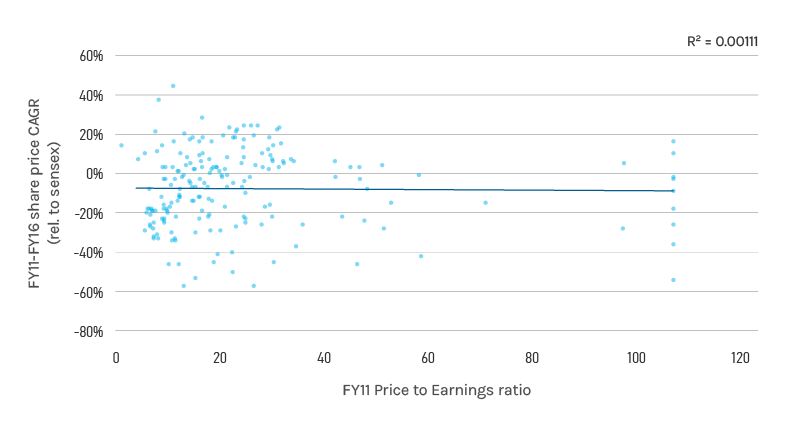
Note: Returns are for top 200 companies relative to Sensex. Trailing P/E has been restricted to 100. Source: Ambit Capital Research. Data as of March 2016.
However, we take a slightly nuanced approach here and describe our investing style as “valuation aware”. While the bulk of our time is spent on looking for superior growth and capital self-sufficiency characteristics as outlined above, we try not to pay top-of-the range multiples. Also when looking at valuations, we pay a lot of attention to the assumptions implicit in those numbers and try to zero in on metrics where we differ from consensus opinion. This approach has two benefits: if you get your growth outlook for a sector or company wrong—and this could inevitably happen in a few cases—the magnitude of losses is much lower than when you pay top dollar. Second, if your growth conviction is vindicated, having entered a stock at sensible valuations inevitably opens up opportunities for re-rating gains along with underlying growth.
None of this means that investing is one smooth upward sloping curve. But if one can filter out the noise and focus on unearthing companies and sectors that meet these criteria, the possibility of making disproportionate returns is much better. With a favourable current taking you to your destination, this is as good a time as any to get your canoe in the water or find a good oarsman to ferry you on his or her boat.