Over years, stock markets relentlessly rise in value. But the graph is never linear and constantly punctuated by turbulence and dips. In theory, we are aware. But bouts of volatility can be unnerving.
In this article, what we seek to bring to your notice is that the performance of an index is often dependent on a very short period of performance history.
Morningstar's Director of Investment Research, Ian Tam, does a convincing take.
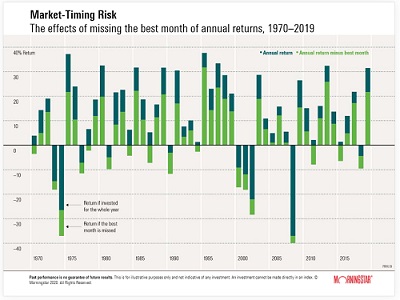
In the above chart, Tam advises us to focus on the Tech Bubble of 2000. It reveals that had you missed the one best month of performance within that given year, your performance in that year would have been about -18%. But had you been invested during the entire year, despite it being a negative year in equities, your return would have been closer to -11% or -12%. Not a great scenario, but you certainly would have been better off had you been invested during the entire year.
This is what is known as critical months.
Critical months are those months whose removal from the return series would eliminate the fund's outperformance over its benchmark.
In 2018, Paul Kaplan, director of research for Morningstar Canada, and Maciej Kowara, associate director of manager research (quantitative), conducted a study of 3,753 equity funds globally, over a 15-year period (November 1, 2003 through October 31, 2018). This provided a long enough time frame to measure long-term performance with a sizable sample.
Through the study, they defined the critical months over that 15-year period. On average, there were just 7.4 or 7.5 critical months.

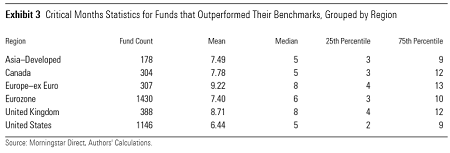
The above images aggregate statistics for critical months, first in aggregate and then grouped by region.
One can immediately see that whether it's mean, median, or the top- and bottom-quartile breakdowns, these numbers are small and should give little comfort to investors who try to find the best times to buy and sell actively managed funds.
In aggregate, the median number of critical months was six. That means that half of the funds' outperformance was due to six or fewer months. One in four months (25th percentile) owed their outperformance to three or fewer months. Finally, three fourths (75th percentile) of all the funds' outperformance was attributable to 10 or fewer months.
These statistics don't vary much among regions.
The obvious implication of these findings is:
- It is exceedingly hazardous to try to time markets.
- Staying invested is the name of the game.
The above information has been taken from:
· Is there a good time to buy or sell actively managed funds?
· The critical reason to stay invested