From the nadir of the financial crisis up to the early days of the pandemic, foreign stocks failed to keep pace with U.S. stocks. And the gap in their postcrisis performance was wide.
The reasons given are that technology stocks have been among the best performers of the past decade and represent a larger share of the U.S. market than foreign markets. An appreciating U.S. dollar hurt foreign stocks' dollar-denominated returns.
Daniel Sotiroff, manager research analyst for Morningstar, digs deeper. He finds that differences in sector composition and a strong dollar played a relatively small role. Differences in earnings growth explain most of this gap. U.S. companies had much loftier earnings-growth rates than their foreign counterparts after controlling for their sector composition, which fueled their superior performance.
His detailed research can be accessed here, below we look at the sector composition.
Does this data indicate that the U.S. market's larger stake in technology stocks explains a significant portion of the disparate postcrisis performance of U.S. and foreign markets?
- From April 2009 through the end of 2019, the MSCI USA Information Technology Index beat the MSCI ACWI ex USA Information Technology Index by 7 percentage points annually.
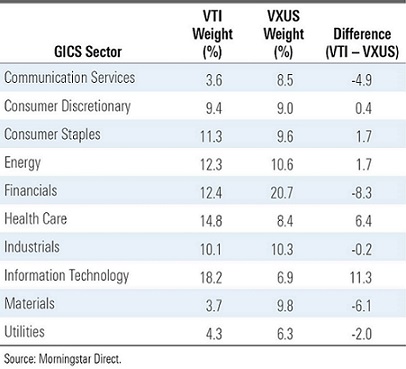
- At the beginning of that period, technology stocks' weighting in the U.S. was about 12% greater than overseas.
That assessment isn't quite complete.
Sector weights and performance can't be analyzed in isolation. Overweighting one segment of the market means others will have a proportionally smaller share. There were other sizable differences in sector weights between the U.S. market (represented by Vanguard Total Stock Market ETF and the foreign market (represented by Vanguard Total International Stock ETF) in April 2009. VTI also had a heavier dose of healthcare stocks, with relatively smaller weights in financials and materials.
Comparing any U.S. sector to its overseas equivalent glosses over differences in the companies within each sector. Looking back at the technology sector in early 2009, Microsoft and IBM were giants in the U.S., while Nokia and Samsung were the big players overseas. All were technology firms, but each one was involved in a fundamentally different business, with different management teams producing different products and services that resulted in different returns to shareholders.
Put another way, differences in sector weights are only part of the puzzle. The impact of individual stocks' performance needs to be considered to fully understand how market composition affected the performance gap.
Below you can see the contribution of sector allocation and security selection. It shows the results of a performance attribution analysis that quantifies how each of these factors contributed to the difference in VTI and VXUS' total returns. The numbers are cumulative and were calculated from April 2009 through December 2019.
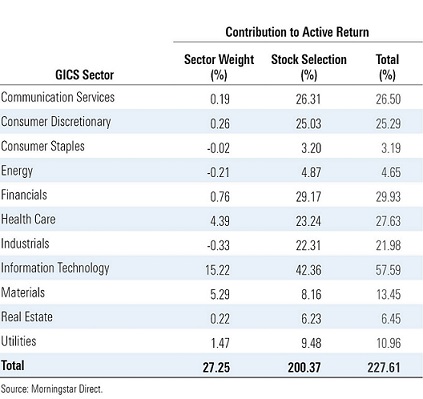
Cumulatively, VTI outperformed VXUS by 227 percentage points over the period. Of that, only 27 percentage points were attributable to differences in sector weights. The bulk of the difference, 200 percentage points, was due to performance differences among the underlying stocks. While the VTI's larger allocation to tech stocks and exposure to better-performing names within the sector were the largest contributors to its relative performance, they still only explained roughly a fourth of the return difference. Across the board, U.S. companies outperformed their overseas counterparts in every sector. Nontechnology stocks, including those from the financials, healthcare, and communication-services sectors, also made large contributions.
We can obtain more insight by using a different decomposition method.
We can split these two markets' returns into two components: price/earnings growth (P/E multiple expansion) and earnings-per-share growth (EPS).
EPS growth incorporates multiple subcomponents, including sales growth, profit margin expansion, and the effects of stock issuance and buybacks.
P/E growth is calculated for each market by annualizing the differential between its ending P/E ratio and starting P/E ratio. That number is then subtracted from a market's total return to arrive at its annualized EPS growth.
Below you can see the results of this decomposition for the MSCI USA and the MSCI ACWI ex USA indexes from April 2009 through December 2019.
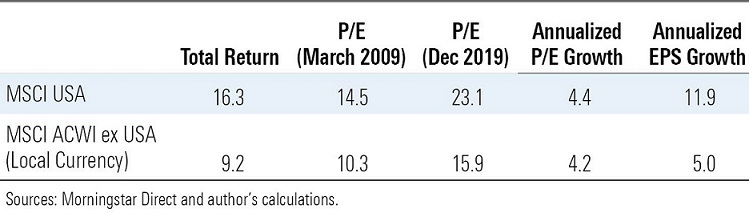
The MSCI USA Index had a slight edge in terms of multiple expansion, but the bigger difference was in annualized EPS growth. On this measure, the U.S. market clearly outpaced the foreign market. The image below combines the currency return, P/E growth, and EPS growth to show how each contributed to the performance gap.

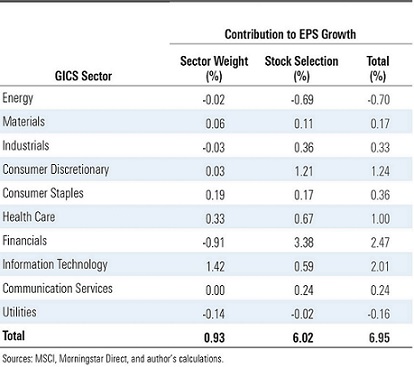
If we further break down the U.S. market's EPS growth advantage. Like the total-return decomposition, stock selection--differences in the underlying companies across U.S. and foreign markets--was responsible for most of the performance advantage. And U.S. financial stocks did most of the heavy lifting. U.S. financial companies experienced a strong resurgence after the financial crisis, while foreign firms in the financial sector have languished.
The past decade has been a one-way market, one in which diversifying with international stocks didn't look like a great idea. But there is still a case to own them. A market can't move in one direction forever. Valuations have to enter the picture, eventually. Owning a diversified portfolio means that some assets will perform well while others do poorly. The question isn't "will foreign stocks come back?" It's a matter of when.