It is said nothing comes free in this world but here's a different take. Certain things do come free and one of them is "risk", it comes free, especially with market-linked investments; oddly, it is the most ignored part of investing.
Take the case of mutual funds. It isn’t uncommon for mutual fund investors to focus only on the past performance i.e. returns while evaluating a mutual fund. The popular perception is--the fund that clocks the highest returns is the best one, hence, it is investment-worthy. But focusing only on returns is fraught with risk, especially while investing in an avenue like a mutual fund.
While evaluating a mutual fund, its showing on the risk and return parameters is equally important. Let’s not forget that in a market-linked investment, the possibility of losing the sum invested cannot be ruled out. Hence, the need to focus on the risk and return aspects
We present a checklist of risk-return metrics that investors can use to study the risk-reward profile of mutual funds:
Standard deviation
Standard deviation is a measure of risk which tells you how much the return of a fund has deviated from its expected returns. For example, if the return of a fund X is 10% and the standard deviation is 2 percentage points, you would expect the return to be between 8% and 12%. In simple words, this ratio helps you understand how volatile a fund is. When a stock or portfolio has a high standard deviation, the range of performance is wide, implying greater volatility. This makes the fund more risky than one with a lower standard deviation.
Sharpe ratio
One of the most popularly used, the Sharpe ratio is a measure of risk-adjusted return i.e. how a fund performs relative to the risk it takes on. Since it measures risk-adjusted returns, a higher Sharpe ratio is a positive. The Sharpe ratio can be used to compare two like funds to determine which fund has delivered higher returns per unit of risk borne.
Sortino ratio
The Sortino Ratio is measure of risk-adjusted return that considers downside risk. Similar to Sharpe ratio, a higher Sortino ratio is considered good i.e higher Sortino ratio indicates lesser chances of huge losses occurring.
Though both Sharpe ratio and Sortino ratio are quite similar, there is one stark difference. Sharpe Ratio considers standard deviation as a measure of risk which does not differentiate between upward volatility and downward volatility. Hence, in a scenario where prices keep rising, the Standard Deviation can be higher, as a result the fund will have a lower Sharpe ratio giving out wrong signal to an investor. On the other hand, the downside deviation used by Sortino Ratio tracks the downside volatility of the fund which means it differentiates between harmful volatility and good volatility. This allows an investor to assess the overall risk of a fund better thereby making it more suitable for those investors who have lesser tolerance for risk.
Up-capture and down-capture ratio
The upside-capture ratio measures how much a fund performs in a up market relative to a relevant index i.e. a benchmark index or a category average. The ratio basically helps you understand how much of the benchmark index's or peer group's up movement the fund has been able to capture.
Similarly the downside-capture ratio measures fund's performance in down markets. It tells you what percentage of the benchmark index's or peer group's fall was captured by the fund. For example, if the up-capture ratio is 110% vis-à-vis the category average, the fund has captured 110% of the category average's upside and hence outscored the same when markets were rising.
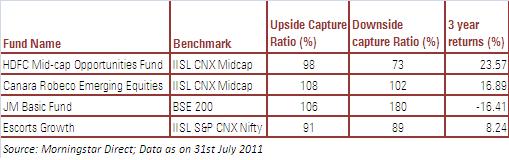
Now consider the funds in the table above. The funds belong to the Morningstar Small & Midcap category. An ideal scenario would be when a fund captures more of the benchmark’s upside and lower downside. At the same time it is advisable for an investor to consider both up-capture and down-capture together and not in isolation.
Like for example in the case of Canara Robeco Emerging Equities, which has a very high up-capture ratio has a very high downside as well. That is the fund has indeed captured 108% of its benchmark’s upside but at the same time it has captured 102% of the downside which is quite high indicating the high downside risk associated with the fund.
Similarly though JM Basic has fared well on the upside, it has fared poorly in the downturn. This is clearly reflected in its ordinary performance on the return front. However if we look at HDFC Mid-cap Opportunities, it has captured just 98% of the benchmark’s up movement and 73% of the benchmark’s downside. It would be fair to assume that risk-averse investors would be inclined to focus more on the down-capture ratio.
Information ratio
Information ratio is used to measure the consistency in a fund’s performance. It typically measures the excess returns clocked by a fund over and above a benchmark like an index or a category average, and the consistency with which the returns were generated. Expectedly, higher the Information Ratio, the better it is considered, as it signifies a more consistent fund.
Then again, some caveats are in order while using the aforementioned ratios for evaluating funds. For instance, the funds need to be of a comparable nature i.e. from the same category. Then again, an apt time period should be considered; for instance, for equity funds, a three-year or longer time frame should be considered for the ratios to be meaningful.
Investors must understand that while making investment decisions, they should not rely solely on risk-return ratios. Rather, the latter should be used to better understand a fund’s nature and draw up a shortlist of funds. Subsequently, they also need to evaluate other factors like the fund manager, the investment process and the fund company's pedigree. Finally, an investment advisor/financial planner must also contribute to the fund-selection process.