In A Graph: Is the market overvalued?

Oct 09, 2023
 

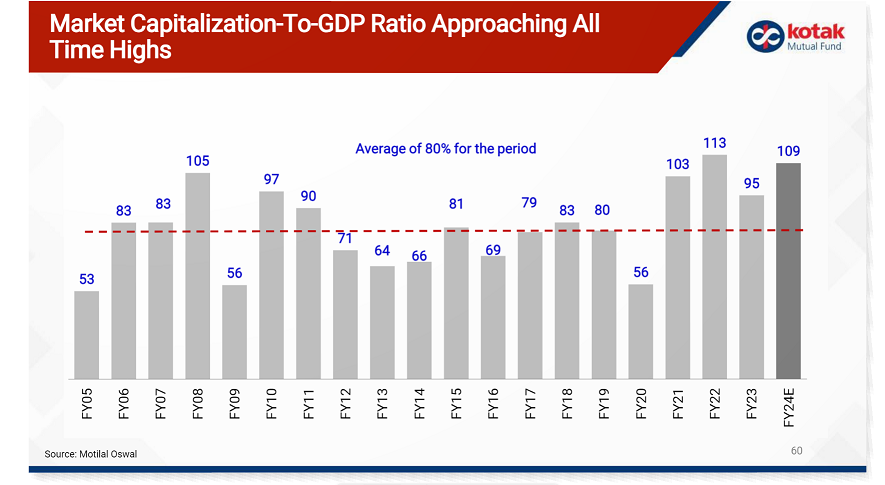
The Market Cap to GDP Ratio divides the total market cap of all publicly-traded stocks in a country by that country’s Gross Domestic Product.

It is used as a broad indication of assessing whether the country’s stock market is overvalued or undervalued, compared to a historical average.

In 2001, Buffett told Fortune magazine that this metric was "probably the best single measure of where valuations stand at any given moment." He said that the U.S. version of the indicator should have provided a "very strong warning signal" of a looming sell-off (referring to the dot com bubble).

Hence, this is also referred to as the "Buffett indicator."

Add a Comment
Please login or register to post a comment.
Prasanth Damodharan
Nov 12 2023 05:39 PM
very good article to understand how market is valued
© Copyright 2024 Morningstar, Inc. All rights reserved.
Terms of Use    Privacy Policy
© Copyright 2024 Morningstar, Inc. All rights reserved. Please read our Terms of Use above. This site is protected by reCAPTCHA and the Google Privacy Policy and Terms of Service apply.
As of December 1st, 2023, the ESG-related information, methodologies, tools, ratings, data and opinions contained or reflected herein are not directed to or intended for use or distribution to India-based clients or users and their distribution to Indian resident individuals or entities is not permitted, and Morningstar/Sustainalytics accepts no responsibility or liability whatsoever for the actions of third parties in this respect.
Company: Morningstar India Private Limited; Regd. Office: 9th floor, Platinum Technopark, Plot No. 17/18, Sector 30A, Vashi, Navi Mumbai – 400705, Maharashtra, India; CIN: U72300MH2004PTC245103; Telephone No.: +91-22-61217100; Fax No.: +91-22-61217200; Contact: Morningstar India Help Desk (e-mail: helpdesk.in@morningstar.com) in case of queries or grievances.
Top