8 interesting charts on India

By Guest |  29-04-16

Microsoft PowerPoint - GTM-Asia_2Q16_MASTER(A5).pptx

Click on image to enlarge

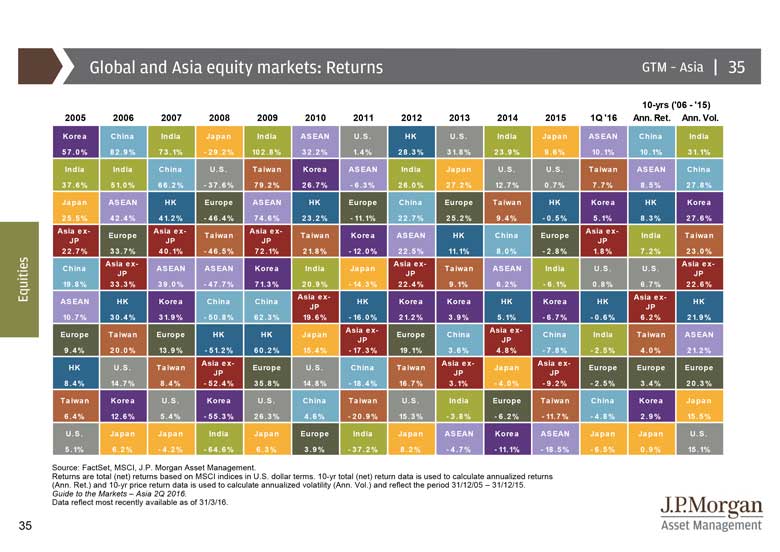
The quilt chart indicates that there is no one single country or region that has strongly outperformed for many consecutive years. When we compare individual countries to a particular region (i.e. ASEAN), diversification within the region has played a key role in minimizing volatility over the longer term.

Add a Comment
Please login or register to post a comment.
© Copyright 2024 Morningstar, Inc. All rights reserved.
Terms of Use    Privacy Policy
© Copyright 2024 Morningstar, Inc. All rights reserved. Please read our Terms of Use above. This site is protected by reCAPTCHA and the Google Privacy Policy and Terms of Service apply.
As of December 1st, 2023, the ESG-related information, methodologies, tools, ratings, data and opinions contained or reflected herein are not directed to or intended for use or distribution to India-based clients or users and their distribution to Indian resident individuals or entities is not permitted, and Morningstar/Sustainalytics accepts no responsibility or liability whatsoever for the actions of third parties in this respect.
Company: Morningstar India Private Limited; Regd. Office: 9th floor, Platinum Technopark, Plot No. 17/18, Sector 30A, Vashi, Navi Mumbai – 400705, Maharashtra, India; CIN: U72300MH2004PTC245103; Telephone No.: +91-22-61217100; Fax No.: +91-22-61217200; Contact: Morningstar India Help Desk (e-mail: helpdesk.in@morningstar.com) in case of queries or grievances.
Top