8 interesting charts on India

By Guest |  29-04-16

Microsoft PowerPoint - GTM-Asia_2Q16_MASTER(A5).pptx

Click on image to enlarge

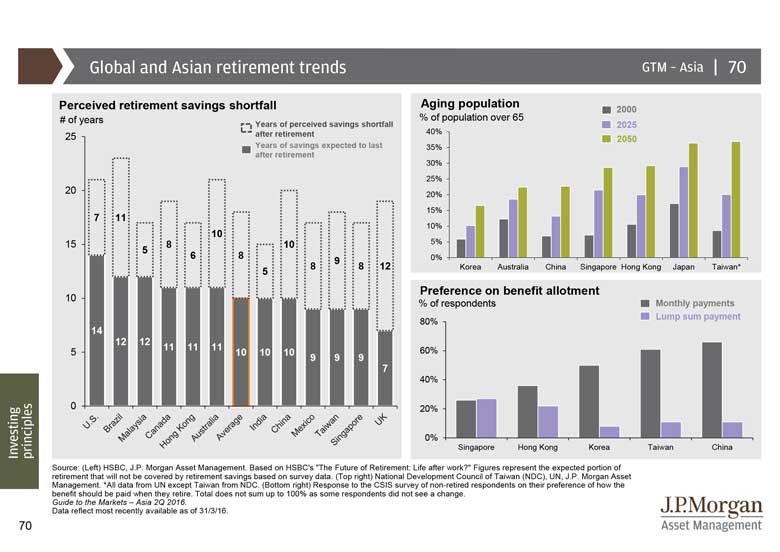
The top right chart shows the percentage of the aging population that some Asian countries face and will have to support in the future. Some countries, such as Japan, face a larger hurdle in caring for their larger proportion of elderly.

The left shows the years of perceived savings shortfall after retirement.

The bottom right charts shows the type of benefit payment scheme retirees would prefer, with most countries wanting monthly payments.

Add a Comment
Please login or register to post a comment.
© Copyright 2024 Morningstar, Inc. All rights reserved.
Terms of Use    Privacy Policy
© Copyright 2024 Morningstar, Inc. All rights reserved. Please read our Terms of Use above. This site is protected by reCAPTCHA and the Google Privacy Policy and Terms of Service apply.
As of December 1st, 2023, the ESG-related information, methodologies, tools, ratings, data and opinions contained or reflected herein are not directed to or intended for use or distribution to India-based clients or users and their distribution to Indian resident individuals or entities is not permitted, and Morningstar/Sustainalytics accepts no responsibility or liability whatsoever for the actions of third parties in this respect.
Company: Morningstar India Private Limited; Regd. Office: 9th floor, Platinum Technopark, Plot No. 17/18, Sector 30A, Vashi, Navi Mumbai – 400705, Maharashtra, India; CIN: U72300MH2004PTC245103; Telephone No.: +91-22-61217100; Fax No.: +91-22-61217200; Contact: Morningstar India Help Desk (e-mail: helpdesk.in@morningstar.com) in case of queries or grievances.
Top