Most advisers offer homogenous services and products to clients. In an increasingly challenging environment where margins are shrinking, competition is increasing, robos and apps are making inroads in investors lives, how can financial advisers distinguish themselves and their practice? How can advisers take a 360-degree view of their clients’ finances and future to help them achieve their life goals? What will differentiate themselves from others is their research backed advice. Used by over 500 advisers in India, Morningstar Adviser Workstation offers some useful features which are being used by advisers to acquire new clients and add value to portfolios. We have listed a few frequently used features of AWS which you will find unique.
1. Common Holding
Investors today are inundated with advice from multiple sources and may end up buying stocks and mutual funds based on past returns without consulting an adviser. Thus, they end up holding multiple funds which could have similar investment mandates. Holding funds with similar mandates leads to concentration in a few stocks which could hurt the portfolio. To get the true benefits of diversification, it is important for investors to hold different asset classes based on their goals. This tool enables you to distinguish the percentage of common holdings of up to 50 funds entered/ selected at a time.
When you approach a prospect who is already investing with some other adviser, how do you convince the client to start investing through you? Through Morningstar’s Advisor Workstation, advisers can use a feature called Common Holding which gives the entire snapshot of current holdings in a few seconds. This report can help you weed out funds having similar mandates and add new funds where there is no exposure. This report will give a fair idea to your investors that you have an edge over others.
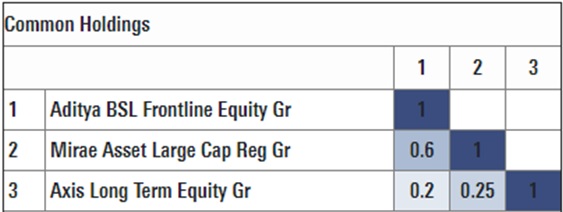
In Exhibit 1, we have analyzed the common holdings of three funds as on April 2018. The chart shows that Axis Long Term Equity and Aditya Birla Frontline Equity have 20% common holdings. Axis Long Term Equity and Mirae Asset Lage Cap have 25% common holdings. Lastly, the similarity of holdings between Mirae Asset Large Cap and Aditya Birla Frontline Equity is 60%.
Exhibit 1
2. Hypothetical
Hypothetical illustrations can be customized to show the past performance of a group of securities over a time period you specify. You would like to show to a client how the funds you are recommending have performed in the past. If the client had invested in your portfolio several years ago, what would the investment be worth today vis-a-vis a stock or ULIP?
Hypothetical Illustrations help support a recommended investment or portfolio strategy to clients and prospects. It allows you to:
- Analyze past performance in relation to a benchmark or competing investments to accurately depict the investor experience
- Illustrate a portfolio with multiple investment types, a reinvestment or withdrawal strategy, and a customized rebalancing schedule, and
- Depict performance during a market downturn and highlight benefits of one investment strategy over another.
3. Portfolio X Ray
This report details a portfolio’s holdings in terms of broad asset class exposure, style box breakdown by equity and fixed-income holdings, and regional exposure. The Portfolio X-Ray Report is the most straightforward way to communicate a portfolio’s overall investment strategy to your clients. It condenses vast amounts of investment information into a clear, concise summary that can be grasped at a glance.
4. Risk/Reward Scatterplot
The report shows the standard deviation and mean return for each holding, as well as the portfolio itself, and the benchmark. In contrast to the Risk/Reward Scatterplot on the Portfolio Snapshot report, this version provides a numbered and color-coded key to understand which dot on the scatterplot reflects each holding.
5. Rolling Return
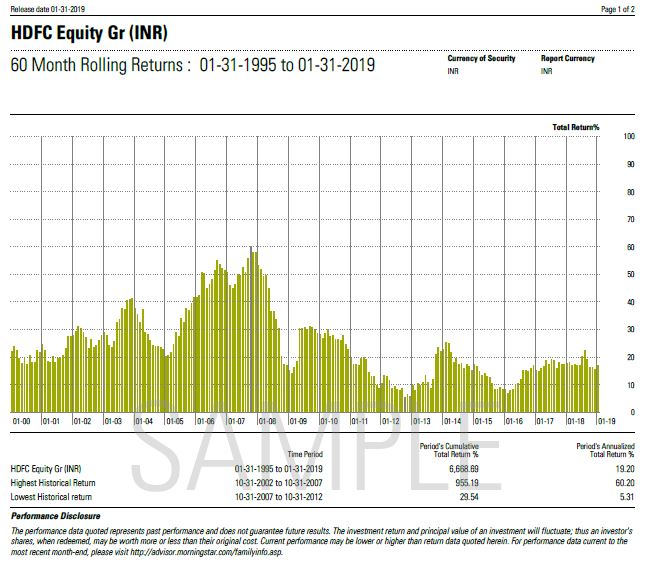
Rolling period returns provide a more detailed view into a fund's performance history vis-a-vis looking at a single-period trailing return. Rolling Returns allows you to look at the best and worst returns for the short or long term. In Exhibit 2, we have shown a snapshot of 60-month rolling returns of HDFC Equity Fund since its inception. The chart shows that the fund delivered its lowest historical return of 5.31% during 2007 till 2012. However, it posted the best annualized return of 60% during 2002-07. Since inception, the fund has delivered 19% CAGR since inception. By looking at the performance over a short and long period of time, you can explain the buy and hold philosophy to clients when they are worried about the negative returns in portfolio and wish to exit or switch from a fund. This will help you to retain clients.
Exhibit 2.
Write to us at IndiaSales@morningstar.com to understand how Morningstar Advisor Workstation can take your practice to the next level.