As the COVID-19 crisis engulfed the world, global indices tumbled sharply from their previous highs. India was certainly not left unscathed. The equity market plummeted 30% in February and March. Investors diligent with their systematic investment plans over the past years were staring at negative returns.
In the throes of the pandemic market crash, one tends to ask, what could I have done to stem the damage?
SHWETABH SAMEER, applied statistical researcher from Morningstar’s Behavioral Science team, and SANDEEP, quantitative analyst from the Morningstar Indexes team decided to take this on. They make a brilliant case for proper asset allocation and rebalancing.
THE CALL FOR ASSET ALLOCATION
Economic events impact different asset classes differently. Some will be winners, others losers, and this varies from time to time. Including an asset class that will perform differently than the rest of the portfolio, helps reduce volatility. Take an example of the Global Financial Crisis (GFC) of 2008. The Sensex saw a precipitous fall of 60% from its peak in January 2008 to March 2009, but short-duration funds provided investors a cushion by returning around 8% on an average during the same period.
Arriving at the right asset allocation is not easy because there are numerous factors that must be considered. Investors with a high risk tolerance would generally keep their equity allocation between 65% to 80%, while those on the other side of spectrum would stick to 15% to 40% to equity. The remaining allocation would be in fixed income investments such as bonds and money market funds. Another option would also be allocating 5% to 20% to gold and international equities to further diversify their portfolio.
Investors typically start out their investment journey being an aggressive investor and become more conservative as they get closer to their retirement. This seems logical as their ability to take risk gradually declines over time.
Deciding on the target asset allocation is half the work done.
Sticking to it, even when the market tumbles, requires grit, because the normal human reaction is to flee from the asset class that is not performing well and shows no apparent sign of returning to normalcy soon. (This is assuming that the individual’s risk tolerance has not changed due to personal events or circumstances.)
The other critical aspect, is rebalancing and monitoring the portfolio over time.
THE IMPORTANCE OF REBALANCING AND MONITORING
Rebalancing a portfolio means strategically buying and selling investments to restore your current portfolio to the original target allocation mix. It allows you to maintain a desired asset allocation over time so that your portfolio matches your tolerance for risk, and you don’t end up taking unintended bets as a result. It means that you will need to sell your investments that are performing well and buy investments that are currently out of favour.
We analysed three approaches of rebalancing to an asset allocation strategy using only two asset classes – equity and fixed income. Our aim is to keep it as simple as possible to drive home the point.
We look at a lumpsum investment of Rs 10 lakh on December 31, 2004, following an aggressive equity strategy.
The investor allocates Rs 7 lakh (70%) to equity and Rs 3 lakh (30%) to fixed income. She lets the investments grow gradually over time and refrains from making any adjustments to the portfolio, regardless of fluctuations in the market.
The investor analyses the portfolio at predetermined intervals and adjusts the portfolio weights to the original target allocation mix. At the end of June and December every year, she periodically adjusts the weights of equity and fixed income back to 70% and 30%, respectively
The investor analyses the drift in weights every day. If the weights drift more than 5% (say, equity becomes 64% and fixed income reaches 36%), she readjusts the weight by taking some money out of fixed income and investing that amount in equity such that equity and fixed income weights revert back to 70% and 30%, respectively. This ensures that she doesn’t get exposed to high (or less) risk than she intended when she set the target allocation.
Based on the above, let’s look at the performance of different allocation approaches in the Indian market over the last 15 years, starting January 2005. Let’s examine the annualized risk and return figures, and max drawdown for the same strategies.
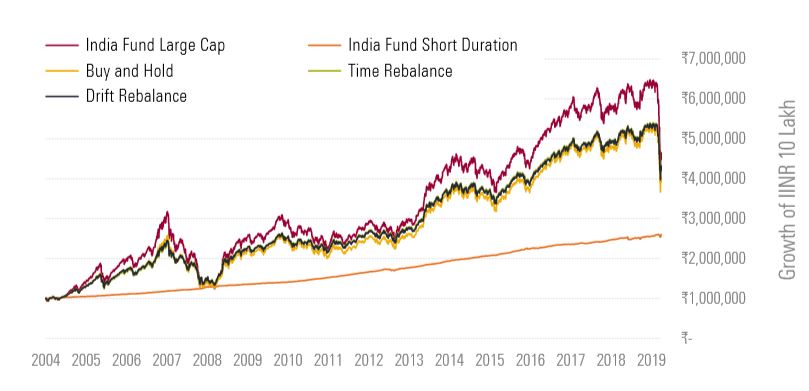
Growth of different allocation approaches
Risk and Return characteristics of different allocation approaches
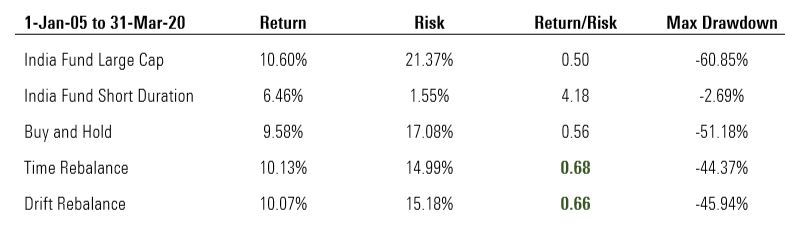
*We use Morningstar Category averages of India Fund Large Cap and India Fund Short Duration to benchmark equity and fixed income performance, respectively. Morningstar Category averages are designed to represent the average return of funds within their category over time.
**Return figures are annualized. Risk is measured by calculating the annualized standard deviation of monthly returns. Drawdown numbers are calculated on daily returns.
The equity market performed considerably well over the entire period – offering an annualized return of 10.6%. This includes various downturns in the market, including the 2008 GFC and the recent volatility over the last two months.
What’s interesting to note is that asset allocation strategies, especially with the rebalance feature, have performed equally well but with lower risk. Part of this comes from the support fixed income investments provide during the downturns. This can be seen when we compare their max drawdown figures – one of the indicators that investment professionals generally use to observe the downside risk of a strategy.
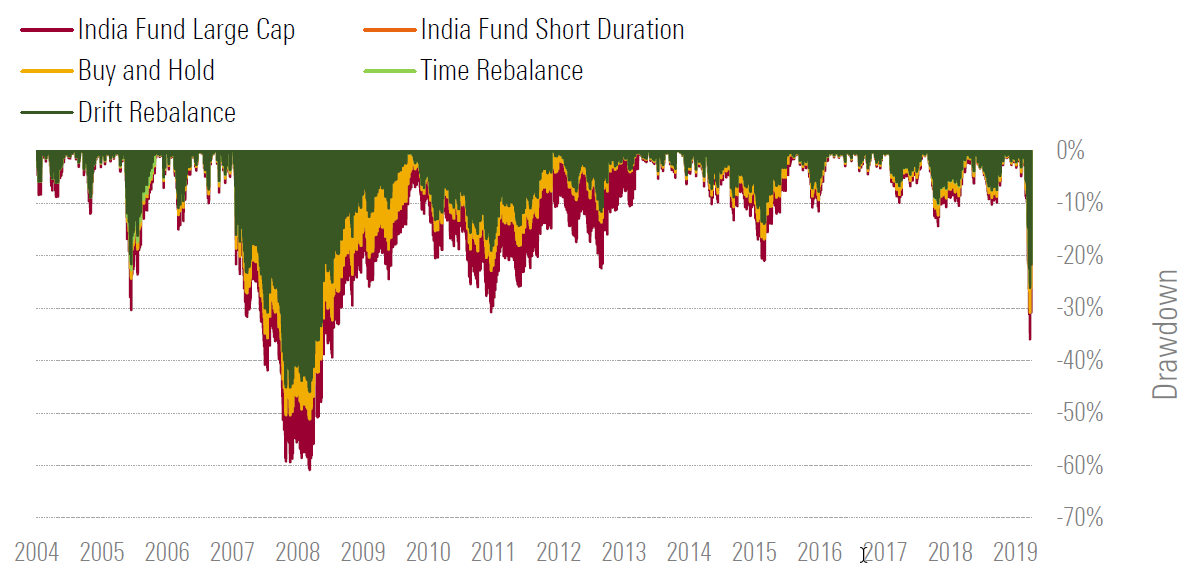
Max drawdown measures the maximum observed loss from peak to bottom in the value of a portfolio before a new peak is achieved. The equity market had a max drawdown of around -61%, which was in March 2009. The buy-and-hold strategy shows slightly lower figures but still higher than those of asset allocation strategies with a rebalance feature (around -45%).
The below illustrates the drawdown figures across time for all the strategies. It’s prudent to reiterate that these numbers are for an aggressive investor. If you have a lower risk tolerance, you should decrease your equity allocation even further.
Why a Drawdown matters
Put it down to basic human tendency. When you see your investments getting crushed in just a few weeks or months, the urge is to sell or even exit the market completely. But the key to a successful long-term strategy is holding on to your investments even during bad times. You are more likely to make a sensible decision if you are able to limit the downside. It will help you stick to your strategy in a bear market while other investors are losing their cool. This is where asset allocation strategies play such a crucial role.
Let’s assume a systematic investment plan.
- SIP amount: Rs 1,000
- Periodicity: End of each month
- Starting: December 31, 2016
What would be the value of the portfolio by March 31, 2020?
- Pure equity (0 rebalancing): Rs 32,904.07
- Buy-and-Hold with a 70:30, equity-debt allocation, which means Rs 700 in equity and Rs 300 in fixed income (0 rebalancing): Rs 35,941.43
- Time-based, semi-annual rebalance (6 rebalances): Rs 36,080.04
- Drift-based rebalance (2 rebalances): Rs 35,950.87
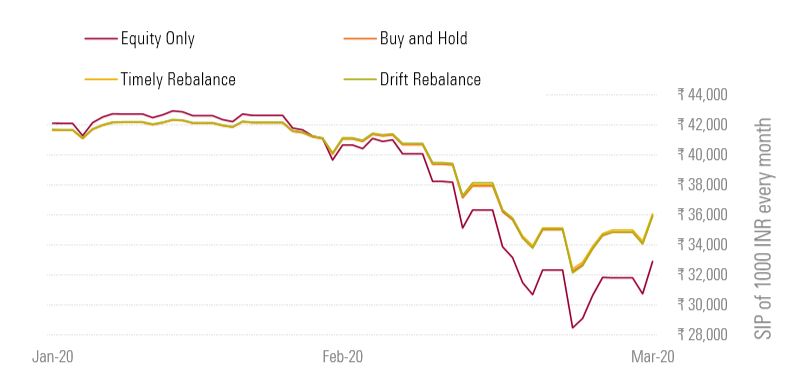
Growth of an SIP of Rs 1,000 every month end, starting December 2016
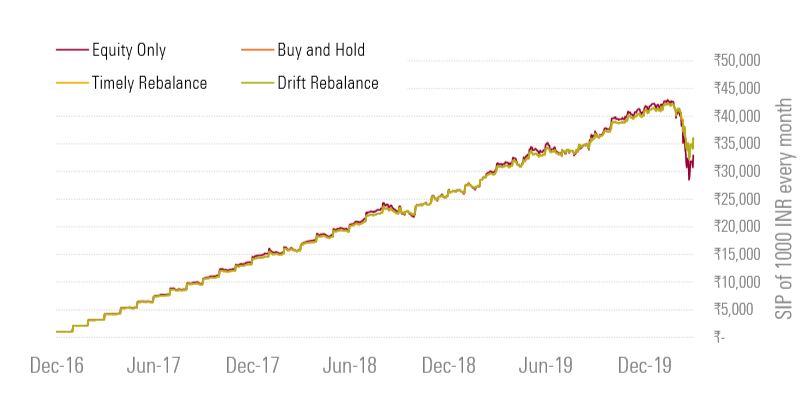
Asset Allocation limited the downside in the last 2 months
The drop in the investment value for the all-equity portfolio is far more severe than the 70:30 asset allocation portfolios.
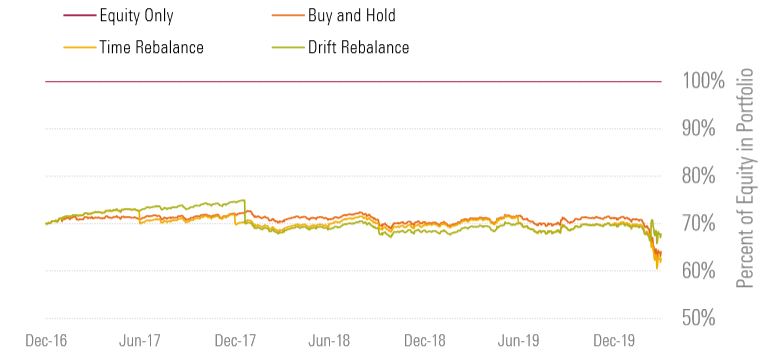
Equity exposure over 3 years
Drift-based rebalance ensured that the equity allocation came back to 70% whenever equity outperformed or underperformed with respect to fixed income. In effect, you sell off and capture gains as equity outperforms and buy more of it when it underperforms.
WHAT’S NEXT?
Proper asset allocation can limit the downside for an investor and decrease volatility.
Ideally an investor should discuss this with her adviser by looking at various asset classes – equity, debt, gold, global equities, and possibly, even real estate. For Do-It-Yourself, or DIY, investors, this can be challenging.
Add to it the behavioural component. No one wants to get down from the ride that is making the most returns. In a following article, we shall tackle this aspect, as well as different investment avenues/vehicles available to an investor who doesn’t want to actively take asset allocation calls.