While global travel certainly ground to a halt in 2020, business does not appear to have become less global. That’s the conclusion DAN LEFKOVITZ, strategist for Morningstar's Indexes group, reached when examining the revenue mix of publicly traded companies, aggregated to the index level.
The coronavirus pandemic will reverse globalization.
Remember the chatter around it last year? For some it was a prediction, for others an aspiration. The virus’ rapid spread across the globe highlighted the fragilities of an interconnected world. Turning inward, increasing self-sufficiency, decreasing dependence on global linkages were plausible responses.
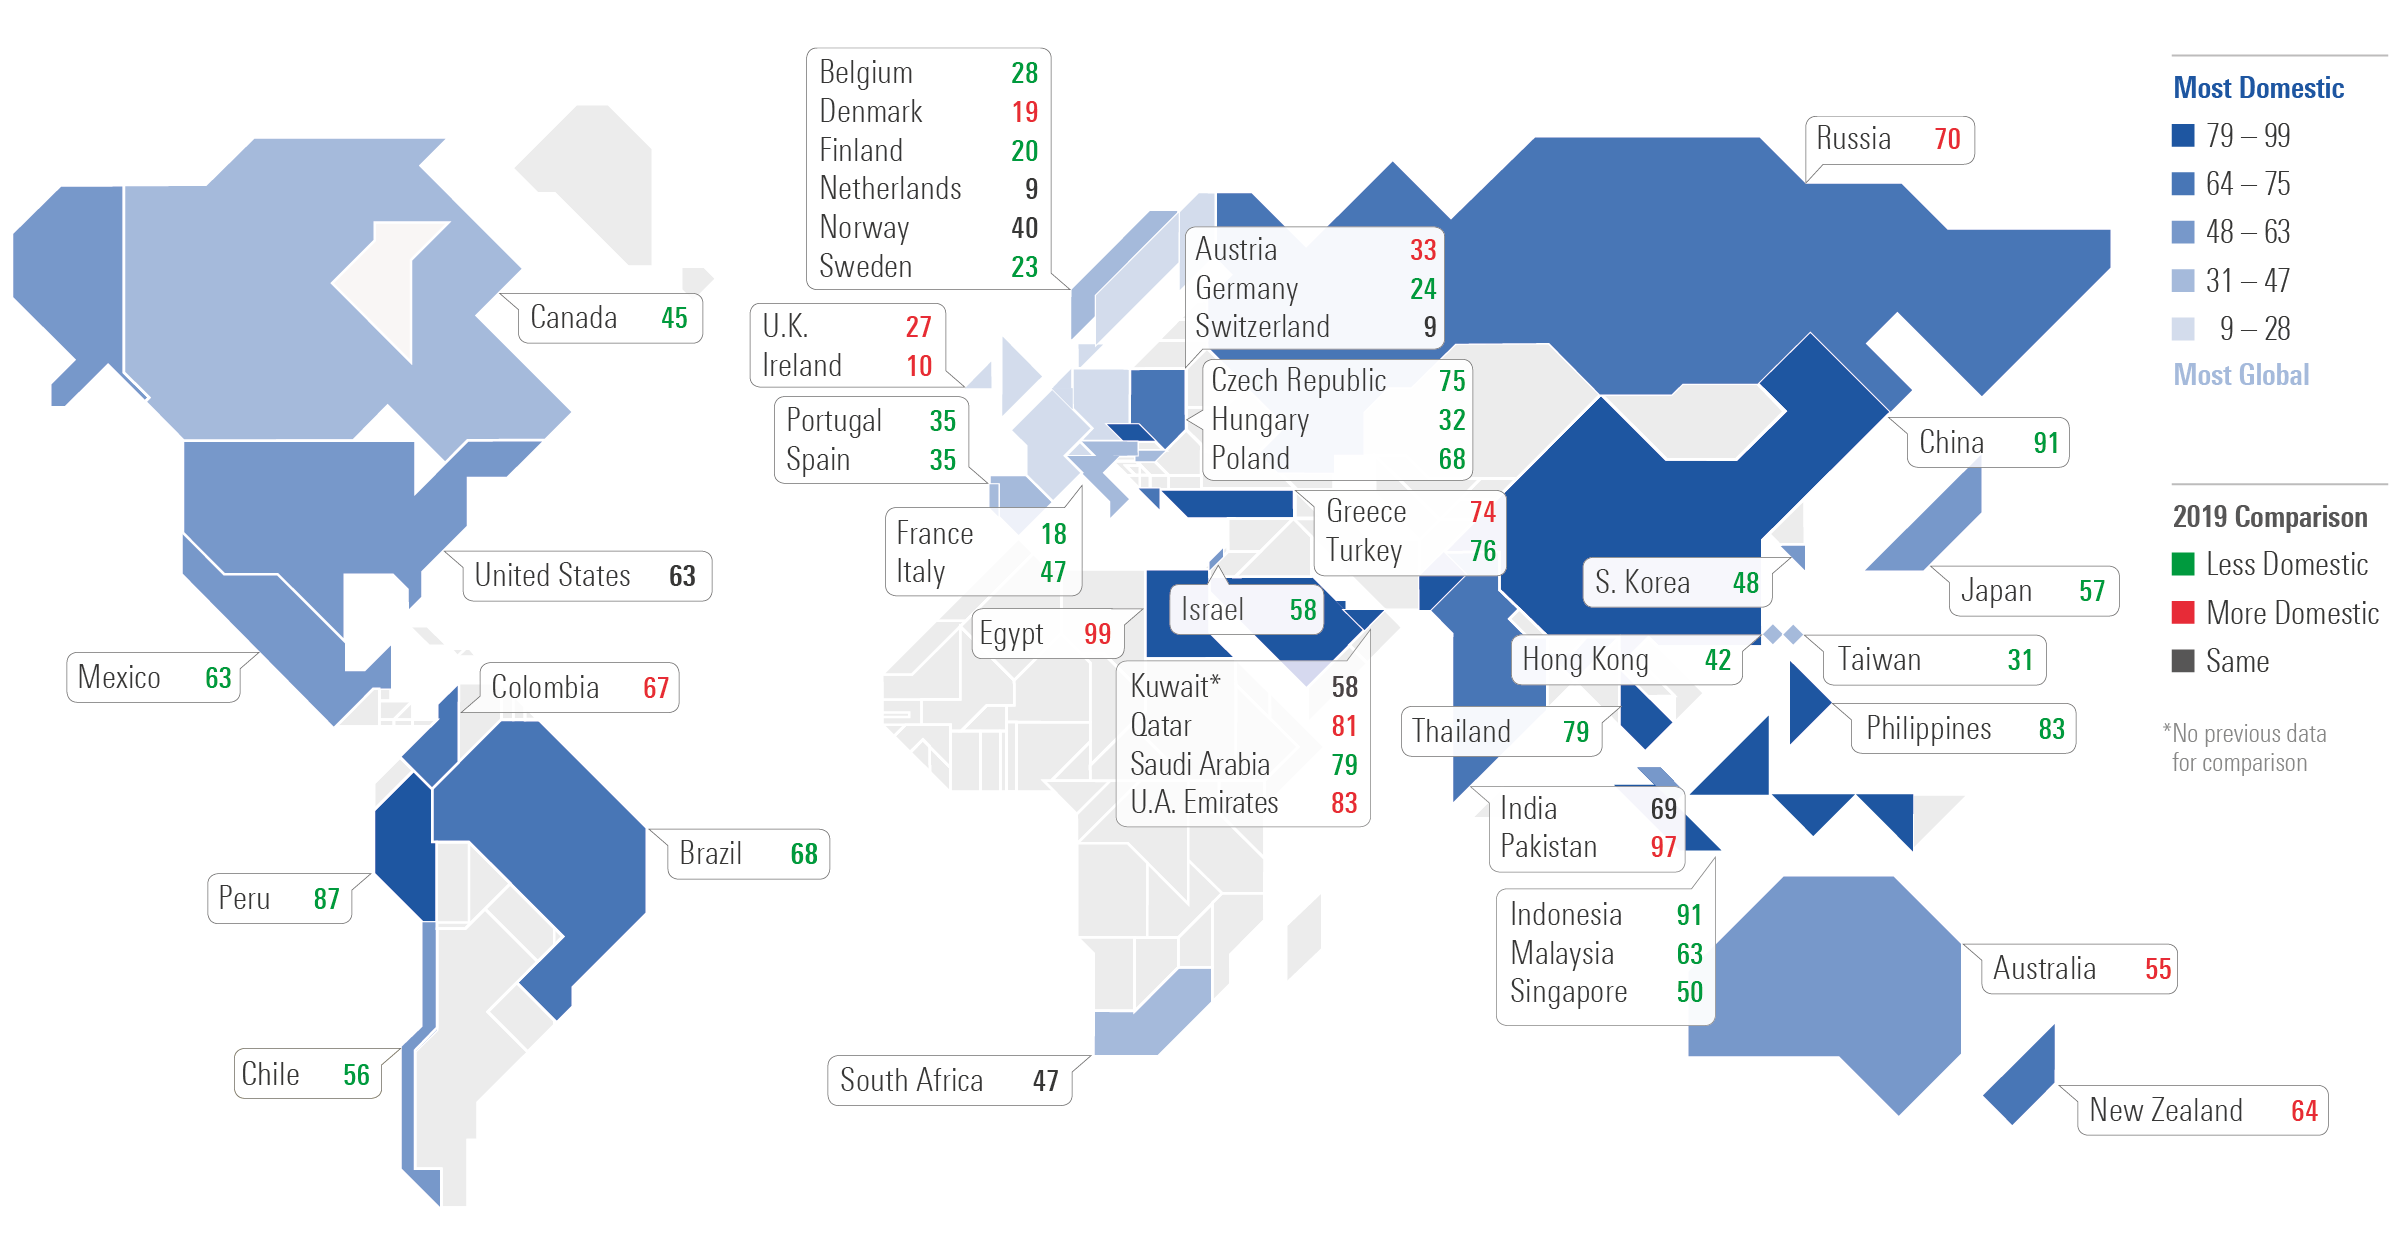
The world map below displays the share of revenue earned domestically for 49 markets across the globe, represented by Morningstar country indexes. Estimates based on annual report data from 2020 shows:
- Only 13 countries becoming more domestically focused in 2020.
- 29 markets became more globalized, with the share of revenues sourced outside the country increasing between 2019 and 2020.
- Nearly all Asian markets turned outward in 2020, despite their pandemic lockdowns.
- The Morningstar U.S. Market Index earned 63% of its revenue domestically in both 2019 and 2020, making it one of several countries whose mix did not change during the pandemic year.
- India held steady at 69% domestic, joining the U.S. among markets whose mix did not change during the pandemic year.
Revenues became more global for Brazil and Asia, less global for Russia and Australasia.
Brazil’s market became significantly more global in 2020, falling to 68% domestic from 77% in 2019 based on estimates from corporate filings. What’s going on? Iron ore miner Vale and Petrobras, the oil and gas company, which together represent roughly 20% of the Morningstar Brazil Index’s market value, each saw a decline in their share of revenue sourced domestically.
This is undoubtedly due to Brazil’s struggles with COVID-19. As the pandemic has ravaged the country, causing the economy to contract by more than 4% in 2020 and unemployment to climb above 14%, Vale reported its share of revenue sourced from China increasing to 57.82% in 2020 from 48.55% in 2019. Robust economic activity in China led to higher demand for the raw material to make steel.
BHP, the Australian mining giant, also saw an increase in revenue share from China, though the Australian equity market as a whole became more domestic in 2020, as did New Zealand's. This inward turn parallels measures both countries have taken to insulate themselves from the pandemic.
Across Asia, most markets became more global, despite borders closing and many economies struggling. Japan, China, Korea, Hong Kong, Taiwan, Singapore, Indonesia, Malaysia, Thailand, and the Philippines all saw an increase in the shares of revenues sourced globally in 2020.
India did not change. Only Pakistan and a couple of Persian Gulf markets became more domestic.
Russia also went more domestic in 2021, likely as an effect of sanctions undermining global revenues for some Russian businesses.
Morningstar Indexes 2020 Revenue Share Map (click on image to enlarge)
India – an Emerging Market exception
The world’s most domestically oriented equity markets belong to emerging economies with large populations, topped by Egypt, Pakistan, Indonesia, and China.
India is an exception to this rule. It is far more global than China and others. This owes to IT service providers like Infosys and Tata Consultancy Services, which both earn the lion’s share of revenue abroad, mostly in the U.S. and Europe.
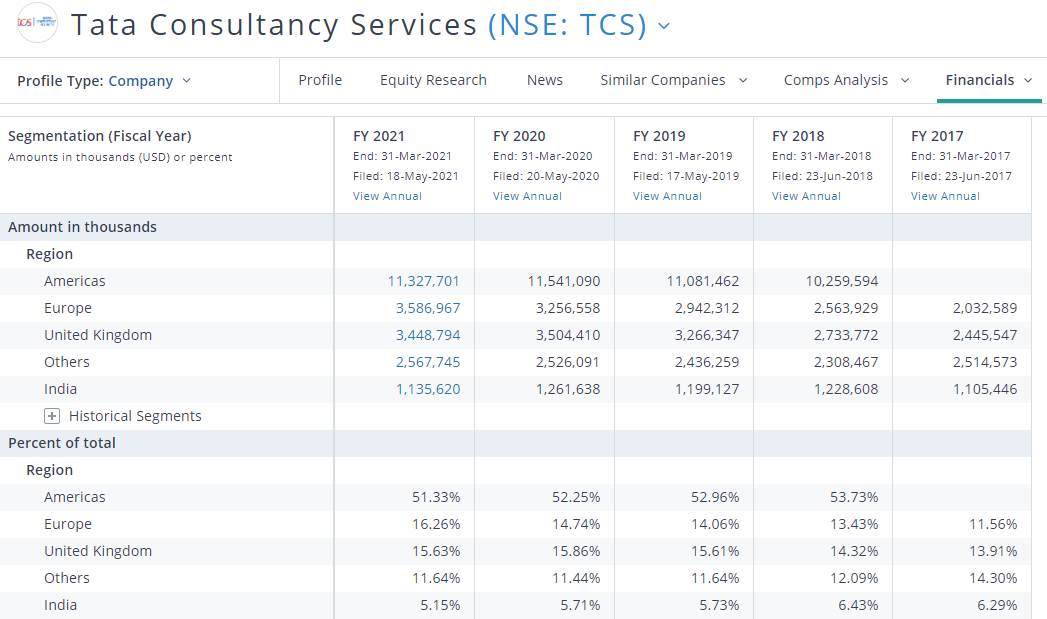
Data sourced from PitchBook and Morningstar. Click on image to enlarge.
Sector dynamics play a significant role in determining a market’s orientation. Sector weights also explain the inward orientation of many emerging markets, such as Indonesia, Egypt, and the United Arab Emirates. HDFC Bank and ICICI Bank are almost entirely domestic and push the Morningstar India Index’s revenue mix inward. Similarly, banks in Canada and Australia push those markets inward even as their natural-resources-focused companies are global.
- Technology tends to be a global sector across markets.
U.S. companies like Apple, Facebook and Google-parent Alphabet all earn the majority of their revenues from outside the U.S. Apple, the world’s largest publicly traded company, reported a 40/60 revenue share split between the U.S. and the rest of the world in its latest 10K. That ratio barely budged from the fiscal year ended in September 2019. While Apple’s share of revenues from China and Japan declined slightly in 2020, that was offset by an increase in the revenue share derived from Europe and the rest of Asia.
Facebook and Google-parent Alphabet are similar to Apple in earning the majority of their revenue from outside the U.S. Microsoft earned 51% of its revenue from the U.S. in 2020, while Amazon’s revenue was 70% domestic. These global players are counterbalanced by large index constituents like UnitedHealth and Home Depot, which source more than 90% of revenue from the U.S., and booking company Expedia Group, whose business went from 57% domestic in 2019 to 68% in 2020 as travel fell off a cliff.
In Asia, Taiwan Semiconductor and Korea’s Samsung Electronics contribute to the outward orientation of their markets. China is an exception, as companies like Alibaba and Tencent are largely domestic players.
- Healthcare is another global sector, boosting global revenues for markets like the U.K., Denmark and Switzerland.
- Financial services, utilities, and telecom tend to be far more domestic.
A key distinction between a country's economy and equity market
Globalized revenue streams provide yet another reason that investors should distinguish between a country’s economy and its equity market.
One of the great investment lessons of 2020 is that the two can move in opposite directions. Although national equity-market indexes are often cited as barometers of their countries’ economic health, markets are a collection of very specific companies influenced by a variety of forces, macro and micro, domestic and global.
This is especially true of European equity markets. The Netherlands, Switzerland, Ireland, Denmark, France, Finland, Sweden, Germany, the United Kingdom, and Belgium all earn 70% or more of their revenues abroad.
The Morningstar France Index, for example, is hardly a proxy for the French economy. Luxury-goods maker LVMH Moet Hennessy Louis Vuitton, the largest public company in France, derives more than one third of its revenues from Asia and roughly one fourth from the U.S. Drugmaker Sanofi the second-largest French company, reports the U.S. as its largest market.
The U.K. equity market already reflects the “Global Britain” envisioned post-Brexit. Just 27% of revenues are sourced domestically. The U.K. became slightly more domestic in 2020, though the margin was small and corporate reporting conventions make precision impossible. Many companies do not break out the U.K. in their revenue reporting. Morningstar estimates that roughly 23% of the U.K. market’s revenue came from the U.S. in 2020, 17% from emerging Asia, and 12% from the eurozone.
Globalized revenue streams have been cited by some as reason to avoid investing internationally. If domestic companies are doing business around the globe, doesn’t that count as geographic diversification? Global interconnectedness has surely contributed to higher correlations between stock markets around the world.
But investors with significant home-country bias are narrowing their opportunity sets and eschewing great investment opportunities—companies that could even be leaders in their home markets. For example, an India-based investor who doesn’t own Facebook or Toyota is missing out on some Indian market champions.
Corporate data from 2020 does not support the view that globalization is in decline. For investors, thinking globally remains critical.
- Index-level data is as of 30 April 2021, based on the most recent corporate filings, typically 2020 annual reports.
- Company-level revenue data represents 99.4% of global market capitalization across developed and emerging markets.
- Data has been collected for 7,311 of the 7,391 constituents of the Morningstar Global Markets Index, of which the individual country indexes are carve-outs.