Financial Sectors Funds and Small/Mid-cap Funds Emerge as the Big Winners
Financial sector funds were the clear winners in 2012, delivering an average return of 59% during the year, compared to about 57% returned by the BSE Bankex index. The hopes of further rate cuts by the RBI, along with good results by some private banks and NBFCs helped fuel the rally in financial stocks during the year. Incidentally banking stocks were among the bottom performers in 2011, with the BSE Bankex index posting a loss of almost 32% during the year. Fund managers also increased allocation to banking and financial stocks considerably during 2012, in portfolios of diversified equity funds. Average exposure to the sector in portfolios of diversified equity funds increased from 20% at the end of 2011 to almost 26% in November 2012.
FMCG sector funds fared well once again in 2012, as the consumption theme continued to play out with investors during the year. These funds were the top performers in the market downturn of 2011 as well, and was the only fund category (from the equity side), to post positive returns in that year.
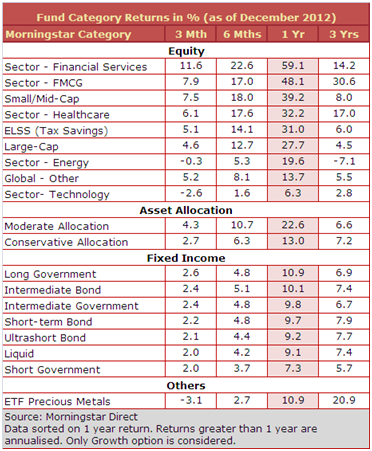
Small/Mid-Cap equity funds also stood out during the year, and managed to beat their large-cap cousins by a good margin. They delivered an average return of 39% during the year, similar to the gains posted by the CNX Midcap and BSE Midcap indices. Large-Cap equity funds posted an average return of 27.7% in 2012, compared to 30% returned by the BSE 100 index and 25.7% returned by the BSE Sensex.
Technology sector funds were the bottom performers from the equity space, delivering an average return of 6.3% during the year, compared to -1.2% returned by the BSE IT index. Weak corporate earnings beat down some of the IT majors like Infosys, which delivered a return of -15% during the year.
Performance Analysis Reveals that a Number of Equity Funds Underperformed their Respective Benchmark Indices in 2012
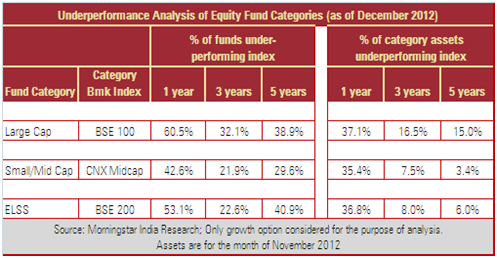
With the markets and indices recovering smartly in 2012, equity funds also fared well—but a number of them underperformed their respective category benchmark indices during the year. Large-cap equity funds delivered an average return of almost 28% in 2012, but around 60% of the funds belonging to the large-cap category underperformed the BSE 100 index during the year. Small/Mid-cap equity funds delivered a handsome return of 39% (on average), but around 42% of the funds in the small/mid-cap category underperformed the CNX Midcap index during the year. A similar observation was made in case of equity tax planning funds (ELSS). This kind of underperformance is usually seen when markets turn around suddenly, as witnessed in 2012.
A look at longer periods (like 3 years and 5 years) paints a more positive picture. The percentage of the funds underperforming their respective category benchmark indices over 3 years and 5 years stands lower than over 1 year. A closer look also reveals that the larger funds (in terms of assets managed) within the respective categories have mostly managed to outperform the benchmark indices. This is quite critical as those are the fund’s where most investor’s money lies. For example, in the last 3 years, 22% of the funds in the Small / Mid-Cap category have underperformed the benchmark CNX Midcap index. However, these funds only account for 7.5% of the category assets—meaning that they have mostly been the smaller funds.
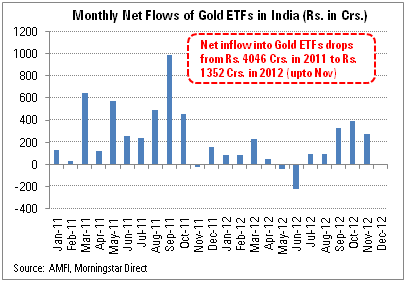
Gold ETFs Lose Some of their Shine in 2012
Gold ETFs lost some of their shine, and delivered an average return of almost 11% during the year, compared to a heady 31% return registered in the previous year. Their performance especially dipped in the last quarter of 2012, as they registered a loss of 3% in those 3 months. However, with gold delivering robust returns in previous years, it has emerged as one of the top performing asset classes over the past 5 years. Gold ETFs delivered a spectacular annualized return of 22% over the same period.
Asset growth of gold ETFs also tempered down in 2012, when compared to the previous year. Gold ETFs registered a 30% growth in assets in 2012 (upto November), compared to hefty 160% growth registered in 2011. Inflows into gold ETFs too moderated down in 2012. They registered a net inflow of Rs. 1,352 crores during the year (upto November), compared to a net inflow of Rs. 4,046 crores in 2011.
Longer Duration Gilt and Bond Funds Top the Charts from the Fixed Income Space
With some monetary easing by the RBI, and on hopes of further rate cuts, bond yields eased during the year. The benchmark 10-year bond yield fell by around 50 basis points during the year. As a result, gilt funds and longer duration bond funds outperformed in 2012. Long government bond funds were the top performing category from the fixed income segment, delivering a return of almost 11% in 2012. Dynamic bond funds and intermediate bond funds also fared well, delivering an average return of around 10% during the year.
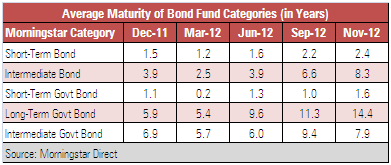
The changing interest rate environment also prompted fund managers to increase the maturity profile of most bond fund categories, to capitalize on the fall in bond yields. The average maturity of long-term government bond funds was increased from about 6 years at the end of 2011 to 14.4 years in November 2012. Average maturity of intermediate bond funds was also doubled to around 8 years at the end of November 2012.
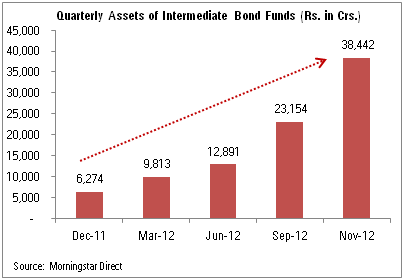
Assets of Intermediate Bond Funds and Dynamic Bond Funds Rise Sharply in 2012
With bond yields softening, and expectations of further rate cuts by the RBI building up, intermediate bond funds registered huge inflows in 2012. The cumulative assets of all funds belonging to the Morningstar Intermediate Bond category grew from just Rs. 6,274 crores at the end of 2011 to Rs. 38,442 crores at the end of November 2012—a stellar growth of more than 500%.
Within the Morningstar Intermediate Bond category, dynamic bond funds especially registered huge inflows and saw their assets rising sharply during the year. The volatile interest rate environment made investors warm up to these funds, where duration is managed more actively. As a result several of these dynamic bond funds managed to outperform during the year, and topped the charts from the fixed-income space. Some of these funds started off with just a handful of crores in assets under management at the end of 2011, but saw their assets rise multi-fold during the year. For example, SBI Dynamic Bond Fund saw its assets rise from just Rs. 70 crores at the end of 2011 to Rs. 4623 crores in the month of November 2012. Other dynamic bond funds like Reliance Dynamic Bond Fund also saw their assets rising several fold in 2012.