We have long spoken about the benefits of long-term investing in a volatile asset class like equities, what really matters is “time in the market” rather than “timing the market”. Over the long haul, the stock market's outperformance over cash boils down to just a few critical months. Miss those months and you will have missed all the risk premium to be earned from holding a volatile asset such as equities.
In its recent study, Morningstar’s Manager Research team has found that between April 2012 and March 2022, Indian stocks owed their outperformance over cash to just 11 months—less than 9.2% of the months in the sample. If you held stocks for all 109 months apart from those 11 months, which we will call "critical months," a term which we will define more precisely below, you would not have beaten cash.
We performed the same test against Indian actively managed diversified equity funds for the 10-year period from April 2012 to March 2022 to determine if the phenomenon applied to them as well. We found that, on an average, outperformance of Indian actively managed diversified equity funds continues to be attributable to a smaller proportion of months: 6 months or 5% of all months, which is similar to the number from the 2021 study of 6 months or 5% of all months. Although this number varies across categories.
This is not just an Indian phenomenon. In a global study released by Morningstar in 2019 it was witnessed similar trends existed for US Large Cap stocks for investments since 1926, where 5% of the months attributed for the overall outperformance over cash. Similarly, the global study of outperformance for the last 15 years found that 5% of months account for the outperformance of actively managed funds globally.
The obvious implication of these findings is that it is exceedingly hazardous to try to time markets. Staying invested is the name of the game, be it in equities as an asset class or the funds you select to invest through.
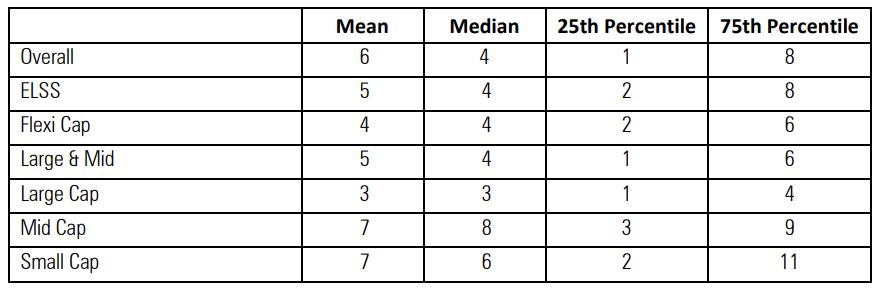
The table below displays aggregate statistics for critical months, first in aggregate and then grouped by fund category. One can immediately see that whether it's mean, median, or the top- and bottom quartile breakdowns, these numbers are small and should give little comfort to investors who try to find the best times to buy and sell actively managed funds.
In aggregate, the median number of critical months was four. That means that half of the funds' outperformance was due to four or fewer months. One in four funds (25th percentile) owed their outperformance to only one month!! Finally, three fourths (75th percentile) of all the funds' outperformance was attributable to 8 or fewer months. Mid Cap Funds were the best of the pack, while expectedly funds with a Large Cap bias came in with the poorest results.
Average number of critical months by category
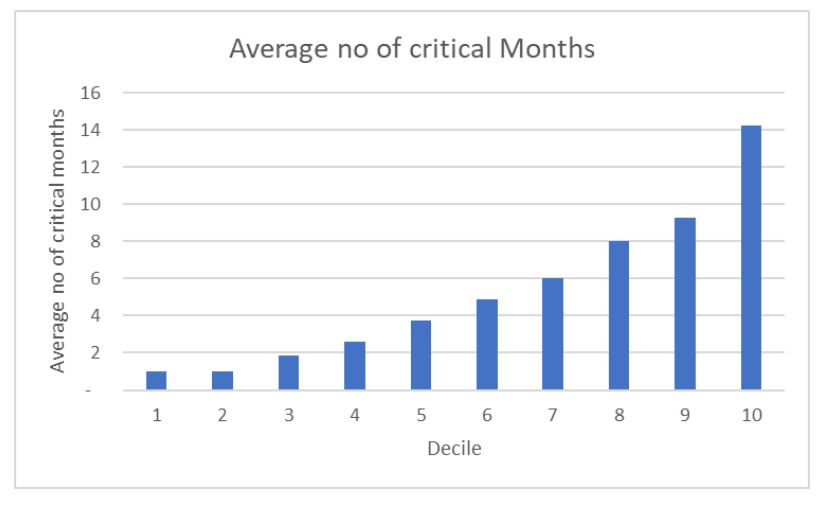
Finally, we divided funds by deciles of outperformance and show how many critical months, on average, each decile had. Even the best decile of outperforming funds, on average, owed their outperformance to just 14 months of excess returns. That is one year and 2 months out of 10 years.
Average number of critical months by decile
Summing up
The most practical implication of our findings—is that trying to find the best time to buy or sell a fund is most likely futile. Most of the time, even outperforming funds basically track or trail the index.
If you think you have identified a skilled manager, the best course of action is to buy in or rupee cost average, regardless of the moment, and hold on to the fund over long periods of time. The obvious, and perhaps even more important, corollary is that a fair amount of patience is required to adhere to such a program. A good manager may take a long time before critical months materialize. Thus, don't sell based on the “what have you done for me lately” rationale.
The gospel of wisdom can be adapted to active management: No one knows the day or the hour when outperformance will strike.