VALUATIONS
The primary metric will be the PE Ratio, supported by the PB Ratio and MCAP/GDP.
Observations:
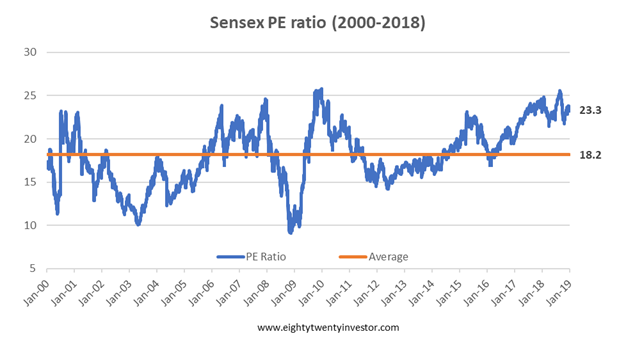
- Current Sensex PE ratio of around 23.3 times, is well above (around 30% above) the long-term average.
- Sensex valuations have usually moved between high and low valuations and eventually revert back to the average.So if we have a 5-7 year time frame and we are getting in now, our returns will improve over and above the earnings growth if the valuations at which we exit is above today’s valuation i.e above 23 times. If it is lower, then our returns will be lower than the earnings growth.
So how do we know the exit valuations?
I have plotted the maximum PE ratio of the Sensex for each and every 2-year period since 2000. In other words, this was the best valuation multiple you got, to exit over a two year period.
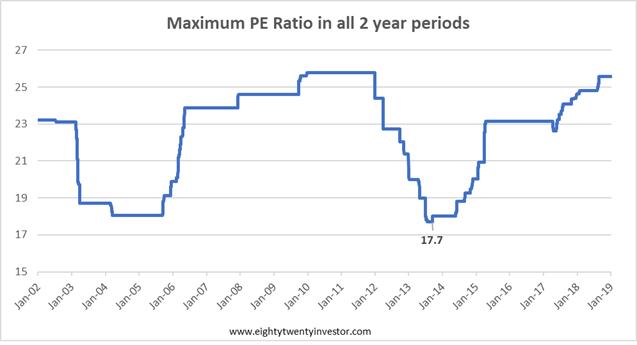
What this means is that historically, you always got a chance to exit at a PE multiple of above 17. Now while there is nothing sacrosanct about this number and the future might be different, it gives us a good starting point to think of exit multiples based on history. If history holds true, I have a high possibility of exiting at least at a PE multiple 17 times (and higher than that if I have luck by my side).
So we can have a rule that states: Post the 5th year (assuming your goal is 7 years away), you exit the moment PE multiple is above 17 times.
This implies your exit valuation multiple in the worst case will be 17 times. In the current context, from our starting multiple of 23.3 it is a drag of 37% or 6.5% per year from earnings growth. If you assume average of 18 times as your exit multiple then it implies a absolute drag of 30% or 5% per year from earnings growth.
Pointing and Calling on PE Valuation: PE ratio implies a possible drag of 5-6% from earnings growth.
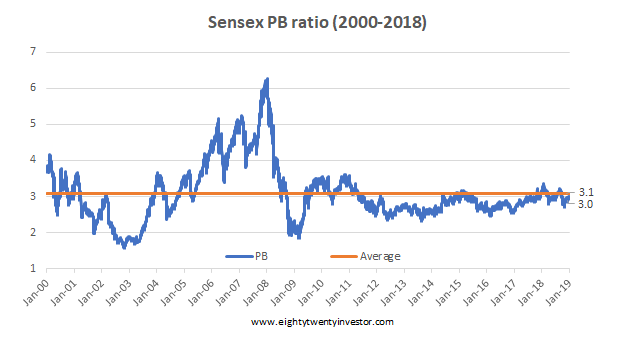
When you look at it from a Price to Book point of view, then the valuations look reasonable as they are close to their long term average.
But why this deviation between PE and PB?
PB = PE * Return On Equity
As seen from the above equation, the culprit for this difference in signals from PE and PB valuations is because of ROE. The ROE for Indian equities is extremely low at this juncture.
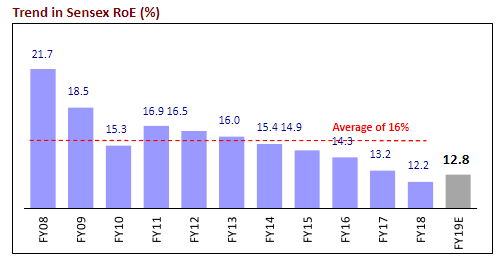
ROE usually tends to mean revert over time. We need to keep this context in mind while evaluating PE valuations which look expensive.
Pointing and Calling on PB Valuation: PB ratio is reasonable. Low ROE leading to expensive PE valuation.

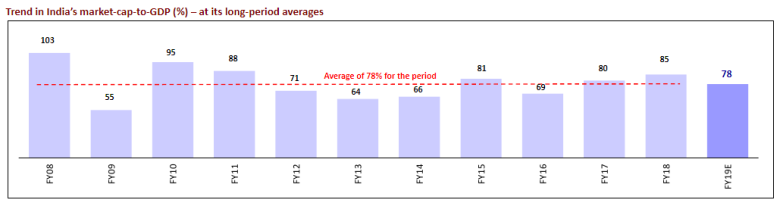 The current MCAP/GDP is close to historical average.
Pointing and Calling on MCAP/GDP Valuation: MCAP/GDP indicates reasonable valuations.