We have often spoken about the importance of assessing equity funds and managers for their investing styles and the rigor with which these styles are followed across market cycles. Comparing fund investment styles in the context of a peer group can also help you create better diversification in a portfolio of funds.
Sizable literature exists identifying various “factors” that are believed to drive investment risk and return. Morningstar Style Box was an early adopter of factor identification, characterizing fund performance along two dimensions size and value-growth. It has since become an invaluable tool for many investors in understanding fund and stock performance.
While factor-based investing is still in its nascency from an Indian Mutual Fund context, managers do take exposure to several known factors. We have heard many a manager talk about their orientation towards a particular style – Growth, Growth at Reasonable Price (GARP) or Value Bias. Similarly, orientation towards size (Large, Mid or Small) is well known. But there are several other factors that come into playing albeit with varying degrees of focus.
To help investors better analyze managed funds along the increasing number of factor dimensions, we introduce the Morningstar Factor Profile, a scientific and intuitive tool to capture the factor exposures of investment portfolios. Morningstar Factor Profile includes seven factors that are widely accepted in the industry as reliable descriptions of the underlying drivers of market performance: size, style (or value-growth), quality, yield, liquidity, volatility, and momentum. The seven factors selected intend to strike a balance between the coverage of the most important factors and a reasonable level of complexity for investors.
Here is a quick look at the factors:
Style
The style factor describes the aggregate expectations of market participants for the future growth and required rate of return for a stock, based on the same measures used for the Morningstar Style Box. A low percentile score for the style factor indicates higher growth.
Yield
The yield factor describes the dividend and buyback yield of a company, based on the trailing 12 months. A low percentile score for the yield factor indicates higher yield for investors.
Momentum
The momentum factor describes how much a stock has risen in price over the past year relative to other stocks, calculated by subtracting the trailing one-month return from the trailing 12-month return. A low percentile score for the momentum factor indicates the company has performed well recently.
Quality
The quality factor describes the profitability and financial leverage of a company, based on an equally weighted mix of trailing 12-month return on equity and debt/capital ratios. A low percentile score for the quality factor indicates a higher quality of the firm.
Volatility
The volatility factor describes the maximum observed spread in long-term returns, based on the trailing 12-month standard deviation of daily returns. A low percentile score for the volatility factor indicates larger variation in long-run outcomes.
Liquidity
The liquidity factor describes the trading frequency of a company, based on trailing 30-day share turnover. A low percentile score for the liquidity factor indicates higher share turnover.
Size
The size factor describes the market capitalization of a company, based on the same measure used for the Morningstar Style Box. A low percentile score for the size factor indicates smaller market capitalization.
How to use Factor Profiles
The chart below shows the exposure of a fund on its factor profiles. Factor profiles not only let you compare the fund’s exposure to the various factors, but you can also compare it against the category average or the index and also get a sense of the range of the historical exposure the fund has had to each factor over a period of time.
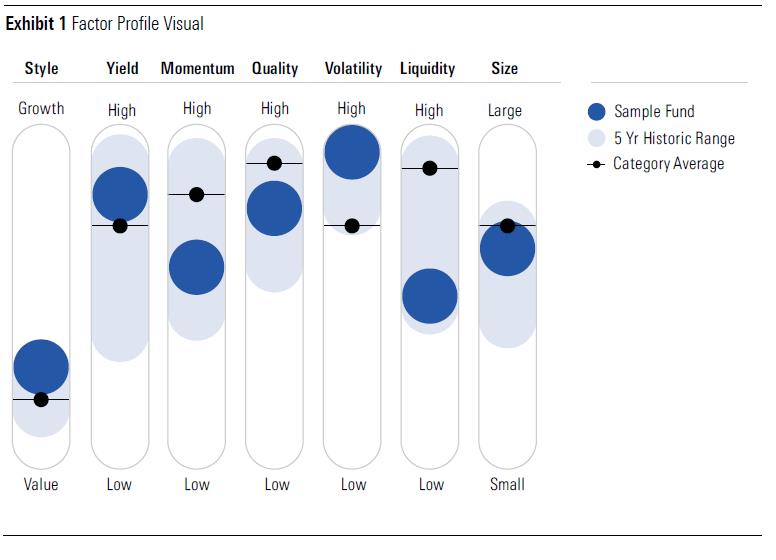
The large dark blue circle denotes the current portfolio exposure of the fund for each factor profile, the small black dot and line denote the category average while the light blue shaded area denotes the historical range of exposure of the fund to each factor over a period of time, in this case the last 5 years.
In the example above, we can clearly see the fund has a value orientation, but currently lower than that of the category average. Historically the fund has largely operated with a value orientation over the last 5 years, but currently has a lower value exposure as compared to the previous time periods. The fund seems to have a reasonably high Yield exposure currently which is also higher than the category average but doesn’t necessarily always follow a high yield approach as can be seen through the range of Yield exposure over time. Liquidity of the portfolio seems to well below the category average as well as compared to its historical Liquidity exposure.
Factor Profiles are an extremely useful tool while evaluating a fund from the context of their stated investment style and exposure to other factors and evaluating if a manager has really been following a particular style. It also helps you choose funds with varying styles and factor exposures to build well diversified portfolio.
In a follow-up article, we will look to assess the factor exposures for a group of popular Indian equity funds.