How is Standard Deviation calculated for a mutual fund portfolio? Or can it be done only for individual funds? When calculating for the entire portfolio, how do you give weightages?
No concepts are more fundamental to investing than risk and return. And when it comes to risk, the most widely used measure to determine the investment risk level of mutual funds is standard deviation, or SD.
What it is, in simple terms.
SD measures the dispersion or spread of a fund's returns around its average return over a certain period of time.
It gives you a sense of how volatile a fund's performance has been in the past so that you can use it as an indicator of how volatile it might be going forward. When a fund has a high SD, it indicates that the past performance has been fairly volatile, and basically indicates a bumpier or more volatile ride compared to another fund with a lower SD.
What it is, in not-so-simple terms.
SD is indicative of the risk in the underlying fund/portfolio. The higher it is, the more volatile the performance; both, the upside potential and risk of drawdowns is higher.
From an asset class lens, equity exhibits higher volatility than fixed-income and commodities, albeit the potential upside too is higher. Well-diversified portfolios reduce the portfolio risk as they invest into diverse asset-classes/securities which respond differently to the same set of economic drivers. This cushions the portfolio against the underperformance of some of its constituents and provides a stable investment journey for the investor.
What it is, in technical terms.
SD is a measure of volatility and denotes the variation in the observed values of a data series about its mean (average).
- Around 68% of the observations within a data series fall within +/- 1 SD from the mean
- 95% observations fall within +/- 2 SD from the mean
- 7% within +/3 SD from the mean
Thus, SD indicates how far the returns are dispersed on either side of the mean.
It measures volatility, not investment risk.
Fund 1 and Fund 2.
Their annualized return over 5 years is 5%.
But Fund 1 has a higher SD as the dispersion of returns from the fund’s mean is much greater than that for Fund 2. Assuming no material change in the fund and/or underlying holdings’ characteristics, one can assume that Fund 1 will likely be a more volatile investment than Fund 2.
Though SD is an indicator of the volatility of returns, it does not measure investment risk as most investors perceive it. For most investors, investment risk is the risk of losing money. Positive returns impact volatility in a similar manner as negative returns. As a result, SD punishes volatility in performance even though on the positive side. It seems odd that positive returns, could make a fund riskier, but that's exactly the effect that they have.
So, how to use SD.
SD should not be looked at in isolation but along with the mean (average).
- Fund A: mean return of 8%, volatility of 10%
- Fund B: mean return of 20%, volatility of 15%
Though Fund B is more volatile, Fund A is likely to post negative returns under a one standard deviation drop scenario (8%-10%=-2%) unlike a positive return in the case of Fund B (20%-15%=5%) despite the higher volatility. However, when viewed in a financial planning context, the higher volatility can lead to returns differing significantly than the mean return estimates thereby impacting the investment portfolio’s projections.
How it is calculated.
SD is calculated as the square root of the average of the squared differences of each observation from the mean. Symbolically, it is denoted as:
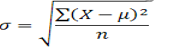
where,
σ = standard deviation of returns
X = observed value of return
µ = mean of the data series
n = number of data points in the series
At a portfolio level...
The SD of India domiciled mutual funds is computed based on the monthly returns for the past 3 years (as prescribed by AMFI) using the above denoted formula. Portfolio level SD can be computed in a similar manner, based on the portfolio level monthly return series, which in turn can be computed from the change in the market value of your portfolio between any two months (assuming no interim top-ups or redemptions).
Investors’ exposure to various asset classes/securities should be in line with their risk-appetite. Before adding any investment to your portfolio, you should consider the impact of the same on the overall portfolio risk.
Registered readers can post their queries by accessing the Ask Morningstar tab. Our team will answer SELECT queries ONLY relating to mutual funds and portfolio planning.