Equity Linked Savings Scheme (ELSS) is one of the popular tax-saving instruments under Section 80 C which allows for a tax deduction on investments up to Rs 1.50 lakh per year.
Choosing the right fund can be tricky as there are 39 ELSS to choose from. Each fund can be different in terms of its investment strategy and style. In this post, we shall look at a few parameters which you should look at while filtering these funds.
These funds are mandated to invest a minimum of 80% of their assets in domestic equity to qualify for tax-saving. One common trait among most ELSS funds is that most of them have large cap bias with at least 60% allocation towards large cap stocks.
Himanshu Srivastava, Associate Director – Manager Research, Morningstar Investment Adviser India, says that the selection of right ELSS is not very different from selecting any other equity scheme and the basic tenets stay the same. “The fund should be selected based on an individual’s long-term goal and risk appetite. It should complement the overall portfolio construct and should provide adequate diversification. ELSS category has funds that are managed with different investment styles. The idea should be to have funds with contrasting styles for the purpose of diversification. Since these funds have lock-in period of three years, which means investors will not be able to redeem investments before that, due care should be taken while selecting these funds.”
Let’s look at some parameters that one should look at while selecting an ELSS:
Don’t chase recent performers
Typically, many Do it Yourself (DIY) investors, who are new to equity markets, tend to invest in recent top performers. While past performance is one of the filters while choosing funds, performance should be looked at from a longer time frame and how consistently the fund has beaten its benchmark and peers over different market cycles.
Rolling period return
One key parameter investors should look at is rolling period returns. Rolling returns are annualized average returns for a period ending with any year. As opposed to trailing period return, which can be skewed with recent performance, rolling return shows average performance across market cycles.
For instance, rolling return shows the average return of a fund over a fixed investment horizon (say 3 years) when evaluated over a period (10 or 15 years). For example, a fund's current trailing three-year return spans just one discrete period. With rolling returns, however, an investor can look back 10 years or longer to see how a particular fund stacked up in every three-year period throughout its relevant history. This will help you gain a fuller understanding of the fund’s historical performance across a market cycle.
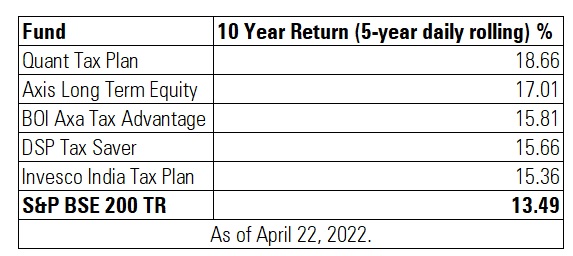
Of 39 ELLS funds, 16 funds have outperformed BSE 200 TRI over a ten-year period as of April 22, 2022. Here are the top five funds which delivered the highest return over a ten-year period on a five year daily rolling basis as of April 22, 2022.
Exposure
While a majority of funds typically hold a predominant exposure to large cap stocks, some funds might have a higher exposure to mid and small cap stocks. While exposure to mid and small cap stocks can help generate excess return during a bull run, it could also come with higher volatility. You should choose a fund that fits your risk appetite.
Some funds like Aditya Birla Sun Life Tax 96, IDBI Equity Advantage, Kotak Tax Saver, UTI Long Term Equity, BOI Axa Tax Advantage, and Motilal Oswal Long Term Equity, have held an average of over 25% exposure to mid-caps over the last three years as of March 2022.
Funds like HDFC Tax Saver, Axis Long Term Equity, Indiabulls Tax Saving, Tata India Tax Saving, and ICICI Prudential Long Term Equity Fund have held an average of over 75% assets in large cap stocks over the last three years as of March 2022.
Investment style
The investment style reflects the characteristics of underlying stocks invested by the fund manager. A growth-oriented fund will hold the stocks of companies that the fund manager believes will deliver earnings faster than the rest of the market. For instance, growth-oriented fund managers typically hold stocks that are trading at a higher Price to Earnings Per Share (P/E) ratio.
On other hand, a value-oriented fund contains mostly stocks the manager thinks are currently undervalued in price and are expected to eventually see their worth recognized by the market. Value stocks will tend to have low P/E as compared to growth stocks.
A blend fund is a mix of growth and value stocks.
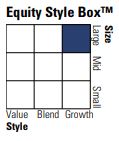
The Morningstar Style Box helps investors construct portfolios based on the characteristics-the style factors of all the stocks and funds that portfolio includes. This style box indicates that the fund follows a growth style with large cap bias.
Investors should typically hold a mix of funds that follow growth as well as value stocks to diversify their portfolio from a style perspective.
READ: How to Make the Most of the Morningstar Style Box
Let’s look at some funds which follow different investment styles.
Growth Oriented Funds:
Blend Oriented Funds (mix of growth and value):
There are no pure value-oriented funds in the ELSS category.
Downside protection
One of the hallmarks of a good fund is superior return but we also need to be mindful of how much risk the fund is taking to generate that return. If a fund’s value drops from Rs 100 to Rs 50, you will need a 100% subsequent return to recover your loss of Rs 50. Thus, protecting the downside during a market fall is extremely essential. Morningstar website provides some useful ratios which help you gauge the risk or downside protection (Downside Capture Ratio) offered by a fund.
A downside capture ratio of less than 100 indicates that a fund has lost less than its benchmark in periods when the benchmark has been in the red. Thus, a lower downside capture ratio is favourable, as it indicates the fund has done well during the downside.
What Upside and Downside Capture Ratios Mean
Maximum Drawdown
It is the peak to trough decline during a specific record period of a fund, quoted as the percentage between the peak to the trough. It measures the largest single drop from peak to bottom before a new peak is achieved. It is an indicator of downside risk over a specified time period. The lesser the number the better the fund is in protecting the fall during a market downturn.
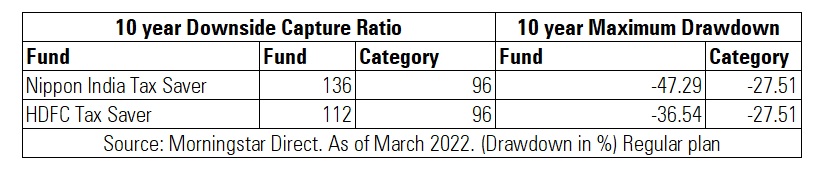
Funds with the lowest downside protection
Funds with the highest downside protection
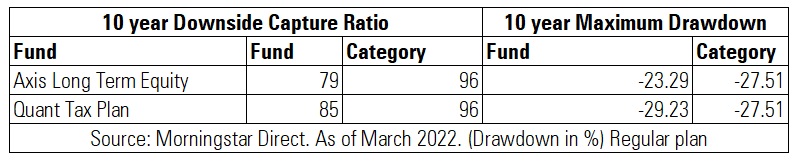
From the above tables, you can see that Axis Long Term Equity Fund and Quant Tax Plan have been able to protect the downside better while Nippon India Tax Saver and HDFC Tax Saver have fallen more than the category during a downturn. While Nippon India Tax Saver has not been so good at protecting the downside, its upside capture ratio has been the highest (105) over a ten-year period as of April 22, 2022. An upside capture ratio over 100 indicates a fund has generally outperformed the benchmark during periods of positive returns for the benchmark.
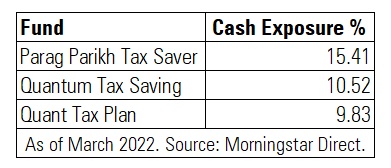
Cash Exposure
Depending on the fund manager’s view, schemes can maintain a high cash level if there aren’t enough opportunities in the market. Cash exposure is maintained to meet daily redemptions. As of March 2022, three funds have cash exposure of more than 9%. Some funds do not take cash calls and remain fully invested while others hold their investments if there aren’t enough opportunities. One advantage of taking cash calls is that it can protect the portfolio during a market fall. On the other hand, if the markets run up suddenly, the fund could lose out on the performance due to higher cash. A higher cash level does not indicate whether the fund is good or bad.
Investors should note that they should not look at just one data point in isolation to shortlist schemes. Rather, each data should be examined in conjunction with other factors like performance consistency, the experience of the fund manager, fund house pedigree, manager tenure with the fund, and your risk appetite, among others while shortlisting funds.
ALSO READ: