Hybrid Funds can be ideal for investors who don’t wish to time the market and yet wish to participate in equities by taking comparatively lower risk. Over a five-year period as of June 7, 2022, the Balanced Advantage Funds category saw a drawdown of -30% while the S&P BSE 500 witnessed a drawdown of -38%.
Typically, most of these funds tend to decrease equity exposure when market valuations are high and vice versa. However, each fund can have its own strategy and the equity/debt exposure can differ based on the fund manager’s view.
We looked at the drawdowns of funds from two categories – Dynamic Asset Allocation Funds and Aggressive Hybrid Funds over a five-year period as of June 7, 2022. We shortlisted funds that have witnessed the least drawdown over this period.
What is Maximum Drawdown? It is measured as portfolio’s maximum loss in a peak-to-trough decline before a new peak is attained. Maximum Drawdown is usually quoted as the percentage between the peak and the trough. It is an indicator of downside risk over a specified time period.
For example, if a portfolio has an initial value of 5,00,000 that increases to 7,50,000 over a period of time, before dropping to 4,00,000. It then rebounds to 6,00,000 before dropping again to 3,50,000. Subsequently, it more than doubles to 8,00,000.
The maximum drawdown, in this case, is as follows:
3,50,000 - 7,50,000/ 7,50,000 = 53.33
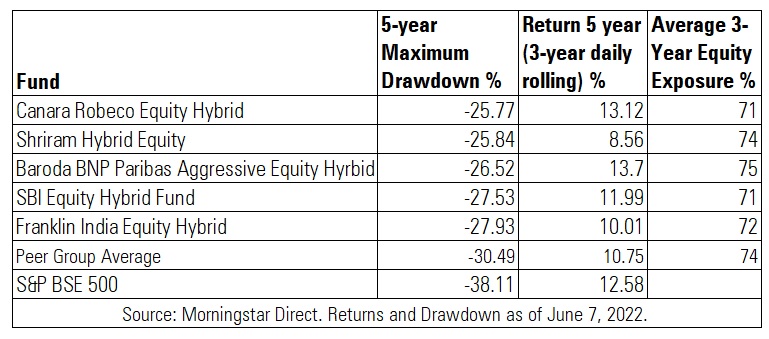
Aggressive Hybrid Funds
These funds can invest in the range of 65% to 80% of assets in equity while the debt exposure can range from 20% to 35%.
Here are five funds that have witnessed the least drawdown in this category.
 Canara Robeco Equity Hybrid Fund
- Star Rating: 4 stars
- Fund Performance: 11.67% (2019), 19.68% (2020), 22.76% (2021), 11.16% (since inception as of June 13, 2022)
- Investment Style: Large Growth
- Equity Holdings: 52
- % of assets in top 10 holdings: 37
- Top 5 holdings: ICICI Bank, HDFC Bank, Reliance Industries, Infosys, State Bank of India
Shriram Hybrid Equity Fund
- Star Rating: 3 stars
- Fund Performance: 8.20% (2019), 12.70% (2020), 14.99% (2021), 9.23% (since inception as of June 13, 2022)
- Investment Style: Large Growth
- Equity Holdings: 44
- % of assets in top 10 holdings: 50
- Top 5 holdings: Reliance Industries, ICICI Bank, ITC, HDFC Bank, Tata Consultancy Services
Baroda BNP Paribas Aggressive Equity Hybrid
- Star Rating: 4 stars
- Fund Performance: 16.26% (2019), 14.91% (2020), 22.16% (2021), 10..70% (since inception as of June 13, 2022)
- Investment Style: Large Growth
- Equity Holdings: 38
- % of assets in top 10 holdings: 44
- Top 5 holdings: ICICI Bank, Reliance Industries, Infosys, HDFC Bank, Kotak Mahindra Bank
SBI Equity Hybrid Fund
- Star Rating: 5 stars
- Fund Performance: 13.49% (2019), 12.90% (2020), 23.60% (2021), 14.72% (since inception as of June 13, 2022)
- Investment Style: Large Growth
- Equity Holdings: 40
- % of assets in top 10 holdings: 36
- Top 5 holdings: ICICI Bank, HDFC Bank, Reliance Industries, Infosys, Kotak Mahindra Bank
Franklin India Equity Hybrid Fund
- Star Rating: 3 stars
- Fund Performance: 7.91% (2019), 13.67% (2020), 23.78% (2021), 13.16% (since inception as of June 13, 2022)
- Investment Style: Large Growth
- Equity Holdings: 48
- % of assets in top 10 holdings: 45
- Top 5 holdings: HDFC Bank, ICICI Bank, Infosys, Axis, Larsen and Toubro
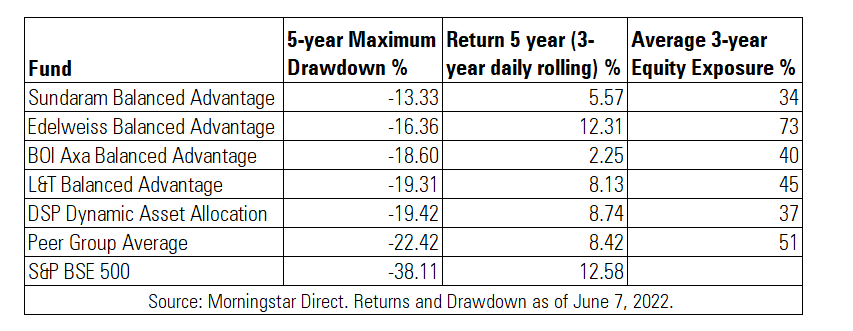
Dynamic Asset Allocation Funds
These funds can change the exposure to equity and debt as the fund manager deems fit or the methodology followed by the fund. Here are five funds that have witnessed the least drawdown in this category.
 Sundaram Balanced Advantage
- Star Rating: 2 stars
- Fund Performance: 1.03% (2019), 10.02% (2020), 10.87% (2021), 7.89% (since inception as of June 13, 2022)
- Investment Style: Large Growth
- Equity Holdings: 120
- % of assets in top 10 holdings: 25
- Top 5 holdings: HDFC Bank, Reliance Industries, ICICI Bank, Infosys, Axis Bank
Edelweiss Balanced Advantage Fund
- Star Rating: 4 stars
- Fund Performance: 7.78% (2019), 22.64% (2020), 18.76% (2021), 9.92% (since inception as of June 13, 2022)
- Investment Style: Large Growth
- Equity Holdings: 147
- % of assets in top 10 holdings: 25
- Top 5 holdings: HDFC Bank, Reliance Industries, ICICI Bank, Axis Bank, Infosys
BOI Axa Balanced Advantage
- Star Rating: 1 star
- Fund Performance: -3.65% (2019), 6.69% (2020), 7.17% (2021), 6.71% (since inception as of June 13, 2022)
- Investment Style: Large Growth
- Equity Holdings: 57
- % of assets in top 10 holdings: 16
- Top 5 holdings: HDFC Bank, Reliance Industries, ICICI Bank, Axis Bank, Infosys
L&T Balanced Advantage Fund
- Star Rating: 3 stars
- Fund Performance: 8.17% (2019), 12.80% (2020), 8.36% (2021), 10.05% (since inception as of June 2022)
- Investment Style: Large Blend
- Equity Holdings: 108
- % of assets in top 10 holdings: 33
- Top 5 holdings: State Bank of India, Reliance Industries, Sun Pharmaceuticals Industries, DLF, ICICI Bank
DSP Dynamic Asset Allocation Fund
- Star Rating: 3 stars
- Fund Performance: 8.79% (2019), 12.93% (2020), 9.31% (2021), 7.73% (since inception as of June 13, 2022)
- Investment Style: Large Growth
- Equity Holdings: 205
- % of assets in top 10 holdings: 15
- Top 5 holdings: ICICI Bank, Bajaj Finance, HDFC Bank, Infosys, Reliance Industries
How to interpret it?
While drawdown is a useful parameter to consider while analysing funds, it should be looked at in conjunction with other parameters. A fund might have lower drawdown because of lower exposure to equity during a bear phase. This will help protect the downside. On the contrary, if the market suddenly shoots up and continues its uptrend, schemes with lower exposure to equity could lag in performance. For instance, HDFC Balanced Advantage Fund had the highest drawdown of -34.49% during a five-year period while Sundaram Balanced Advantage had the least drawdown of -13.33%, as of June 7, 2022.
But lower drawdown has not necessarily helped Sundaram Balanced Advantage Fund as its 3-year daily rolling return for five years is 5.57% while HDFC Balanced Advantage Fund delivered 8.66% during the same time frame.
Before the precipitous fall in April 2020, Sundaram Balanced Advantage Fund maintained an average exposure of 29% exposure to equity from January 2020 till March 2020. In April 2020, the fund’s equity exposure increased to 66%. As the market started recovering, the fund started decreasing its equity exposure. Over the last three years, its average equity exposure has been 33%, which implies that the fund is less aggressive in taking equity exposure. Hence, having a conservative equity exposure dented its returns.
From January 2020 to March 2020, HDFC Balanced Advantage Fund had an average of 81% exposure to equity, which explains its highest drawdown in the category. This fund takes a more aggressive equity exposure, which stood at an average of 77% during the last three years.
Similarly, ICICI Prudential Balanced Advantage Fund, which had the second-highest drawdown of -27.07% has delivered 10.03% on a 3-year rolling return over a five-year period, which is higher if we compare it to Sundaram Balanced Advantage Fund’s return (5.57%) over the same time frame.
To sum up, each fund within a category can be different based on its style and strategy. Investors would do well to choose a fund that suits their risk profile.