Despite global uncertainty and market volatility, domestic investors have continued to allocate steadily across mutual funds in FY2026, highlighting resilient investor behavior.
Market dynamics, have witnessed a sharp shift over the past month following the escalation of geopolitical tensions in the Middle East. The conflict involving the U.S. and Israel on one side and Iran on the other has extended beyond regional boundaries, with broader implications for global markets. Concerns around energy supply disruptions, elevated crude prices, and potential supply chain bottlenecks have weighed on investor sentiment, influencing both market performance and investment decision-making.
In fact, Indian equities in FY2026 have exhibited a transition from a liquidity-driven rally in the earlier part of the year to a more risk-averse environment in recent months. Strong initial gains were gradually eroded amid rising geopolitical tensions, sustained FII outflows, and evolving macroeconomic pressures, resulting in a relatively weaker market outcome despite resilient domestic fundamentals.
That said, domestic investors have demonstrated notable adaptability. Rather than retreating from markets, they have continued to deploy capital, recalibrating allocations in line with changing market conditions and emerging opportunities.
As we await the AMFI data for March to assess the full-year flow trend for FY2026, it is useful to examine the trends observed so far and understand how investor preferences have evolved over the course of the year.
Flow Trend in Equity-Oriented Mutual Fund Categories
Through FY2026 (till February), equity-oriented mutual fund categories garnered net inflows of INR 3,061 billion. While this marks a moderation compared with FY2025 (INR 4,171 billion), the flows remain meaningful, especially given the challenging market environment. The persistence of inflows during a period marked by heightened volatility and global uncertainties underscores the resilience of domestic investors.
A key shift in the flow pattern has been the sharp slowdown in sectoral/thematic funds, which were the primary drivers of inflows in FY2025. Net inflows into this category declined significantly to INR 273 billion in FY2026 (till February), compared with INR 1,467 billion in the previous year—a drop of over 80%. This moderation is also reflected in primary market activity, with fewer launches and lower collections during NFOs. While 52 sectoral/thematic funds were launched in FY2025, raising INR 736 billion, FY2026 has seen 34 launches mobilizing INR 216 billion, indicating waning investor appetite for such strategies.
The large-cap category also witnessed a decline in inflows, with net investments falling to INR 302 billion from INR 423 billion in FY2025, suggesting some moderation in allocations to relatively stable segments.
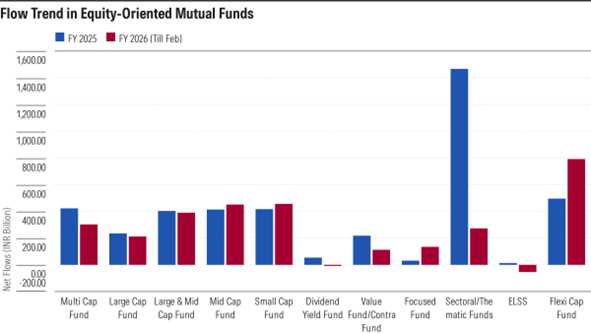
The data for FY 2025 is between Apr 2024-Mar 2025, whereas that for FY 2026 is between Apr 2025-Feb 2026. AMFI monthly flow data for March 2026 is awaited.
In contrast, categories such as flexi-cap, mid-cap, small-cap, and focused funds continued to attract healthy inflows, with some even surpassing last year's levels. The flexi-cap category, in particular, emerged as the most preferred segment, recording the highest inflows among equity categories. This reflects investor preference for strategies offering allocation flexibility across market capitalizations, especially in a volatile and valuation-sensitive environment.
Notably, mid-cap and small-cap funds saw an uptick in inflows despite elevated valuations. Mid-cap funds attracted approximately INR 451 billion (vs. INR 414 billion in FY2025), while small-cap funds received INR 456 billion (vs. INR 417 billion). This suggests that investors continued to selectively allocate to higher-growth segments, potentially using market corrections as an opportunity to build exposure.
As of February 2026, assets under management in equity-oriented funds stood at INR 35,395 billion, highlighting the sustained depth and participation in the equity mutual fund space.
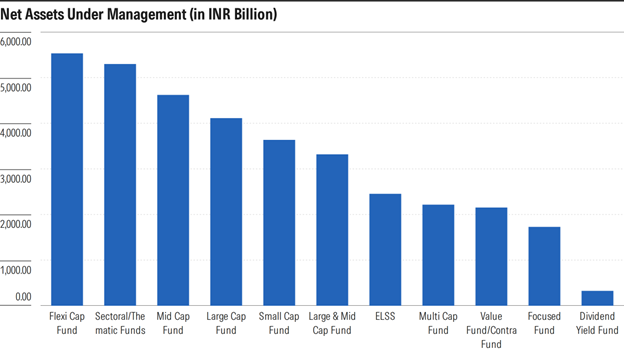
Net assets under management are as of February 2026.
Flow Trend in Debt-Oriented Mutual Fund Categories
Debt mutual fund flows in FY2026 (till February) reflect a marked shift in investor preference compared to FY2025, with a strong tilt toward liquidity-oriented and short-duration categories. Overall flows have risen sharply from about INR 1,384 billion in FY2025 to nearly INR 3,171 billion in FY2026 (till Feb), indicating heightened allocation to debt as an asset class. However, this increase is largely driven by institutional and treasury-led allocations into liquid, overnight, and money market funds rather than broad-based duration or credit exposure. Liquid funds, in particular, saw a significant jump in inflows, alongside a sharp turnaround in overnight funds from outflows in FY2025 to strong inflows in FY2026, highlighting the preference for low-risk avenues to park surplus cash amid an uncertain environment.
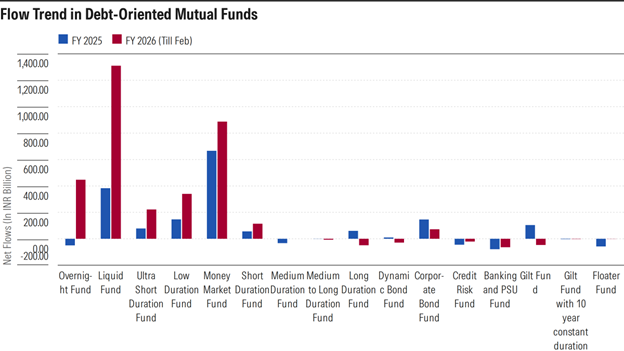
The data for FY 2025 is between Apr 2024-Mar 2025, whereas that for FY 2026 is between Apr 2025-Feb 2026. AMFI monthly flow data for March 2026 is awaited.
At the same time, categories at the shorter end of the curve-such as ultra-short duration, low duration, and short duration funds-continued to witness healthy inflows, with momentum improving in FY2026. This suggests that investors are comfortable earning accrual income without taking meaningful duration risk, especially in a scenario where the interest rate cycle remains uncertain. In contrast, there has been a clear reversal in flows into longer-duration categories. Long duration, dynamic bond, and gilt funds, which saw modest inflows in FY2025, have experienced outflows in FY2026. This shift reflects investor reluctance to take duration calls given heightened geopolitical tension, volatility in inflation and crude oil prices, and uncertainty surrounding further cut in interest rates.
Credit-oriented categories such as credit risk funds and banking & PSU funds have continued to see subdued or negative flows across both years, indicating a sustained preference for high-quality portfolios and a cautious stance toward credit risk following past episodes of stress in the segment. Corporate bond funds, while still witnessing inflows, have seen moderation in FY2026, as investor preference has clearly skewed toward more liquid and flexible investment options. Overall, the flow pattern in FY2026 underscores a defensive and liquidity-driven approach, with investors prioritizing capital preservation, flexibility, and accrual income over duration-led returns.
Flow Trend in Hybrid Funds & Gold ETFs
The flows into Gold ETFs jumped sharply during FY2026. While the segment received net inflows of INR 149 billion in FY2025, it received a net inflow of INR 666 billion until Feb in FY2026.
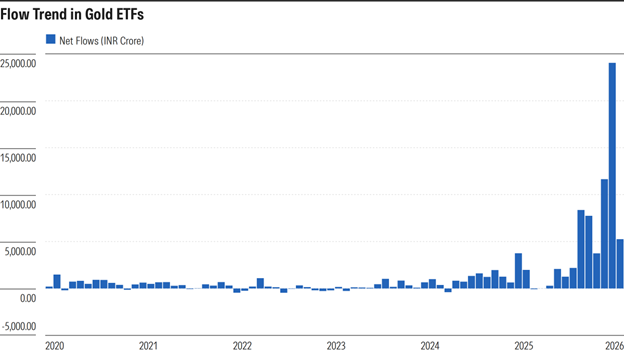
High net inflows in the segment therefore underscores gold’s enduring appeal amid heightened market volatility and persistent geopolitical risks. Gold ETFs continue to benefit from their role as portfolio diversifiers and their convenience, liquidity, and transparency as a means of gaining exposure to the metal. The trend indicates that gold is increasingly being utilized not just for tactical purposes but also as a strategic component in investor portfolios. Moreover, the healthy returns generated by gold in recent years have also supported investor interest.
Hybrid Funds Pick Momentum
Hybrid strategies appear to have benefited from the uncertain and volatile market environment of FY2026. These funds have attracted investor interest because of their ability to balance risk and return through allocation across asset classes, offering a relatively smoother investment experience during uncertain periods.
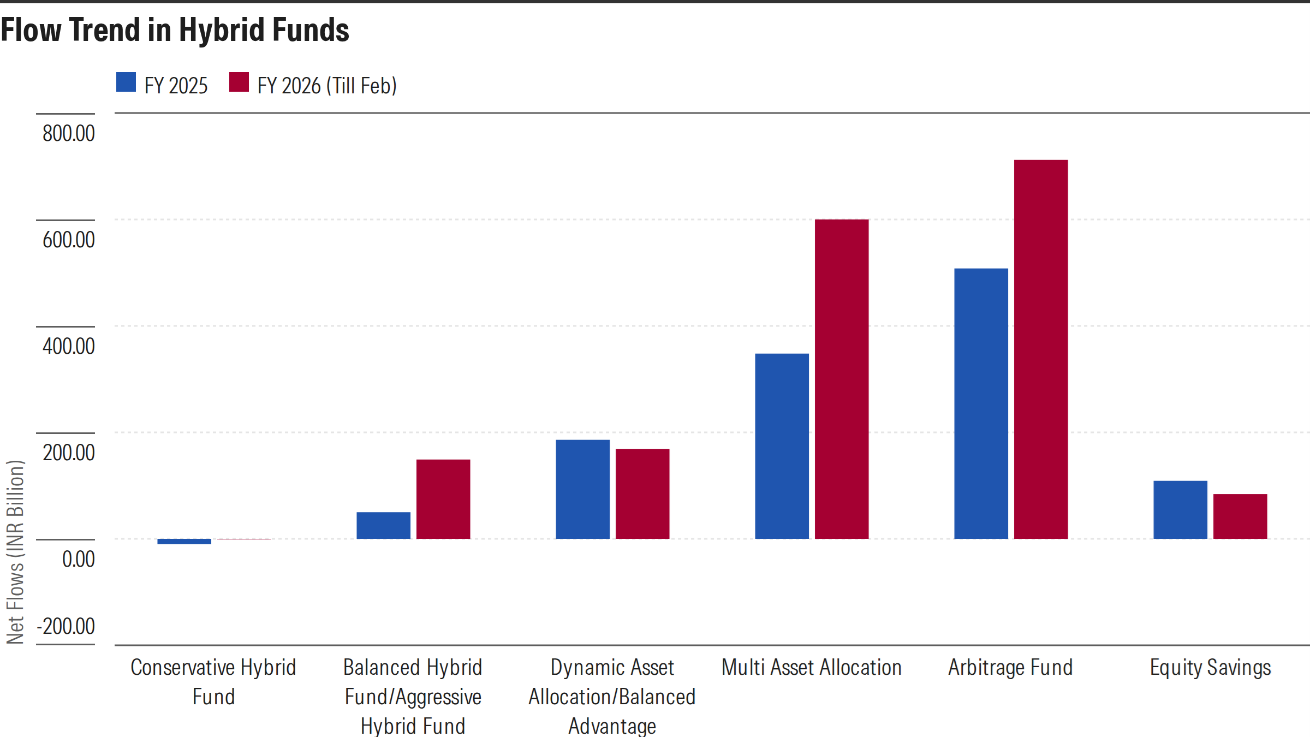
Overall, the trend suggests a more cautious investor stance, with greater preference for asset allocation, diversification, and relatively resilient portfolio structures over pure equity exposure during uncertain environment.
SIP Contribution
SIP contributions continued to remain robust during the financial year, highlighting the growing discipline among retail investors toward systematic investing. For FY2026, SIP collections stood at INR 3175 billion as of Feb 2026, significantly higher than INR 2,894 billion recorded through FY2025. The overall trend remained strong, supported by rising investor awareness, sustained participation from retail investors, and the increasing adoption of SIPs as a preferred route for long-term wealth creation. The consistent inflow pattern also underscores investors' desire to remain invested through market volatility and benefit from rupee-cost averaging over time.
Conclusion
The evolving flow patterns reinforce the importance of disciplined portfolio construction and maintaining balance across asset classes. While growth-oriented segments such as mid- and small-caps have attracted strong investor interest, periods of heightened equity participation can also lead to concentration risks. Complementing such exposures with stabilising assets such as fixed income, hybrid strategies, and gold can help manage volatility and enhance portfolio resilience. Maintaining a well-diversified and disciplined asset allocation framework remains essential for investors seeking to stay aligned with their long-term financial goals.